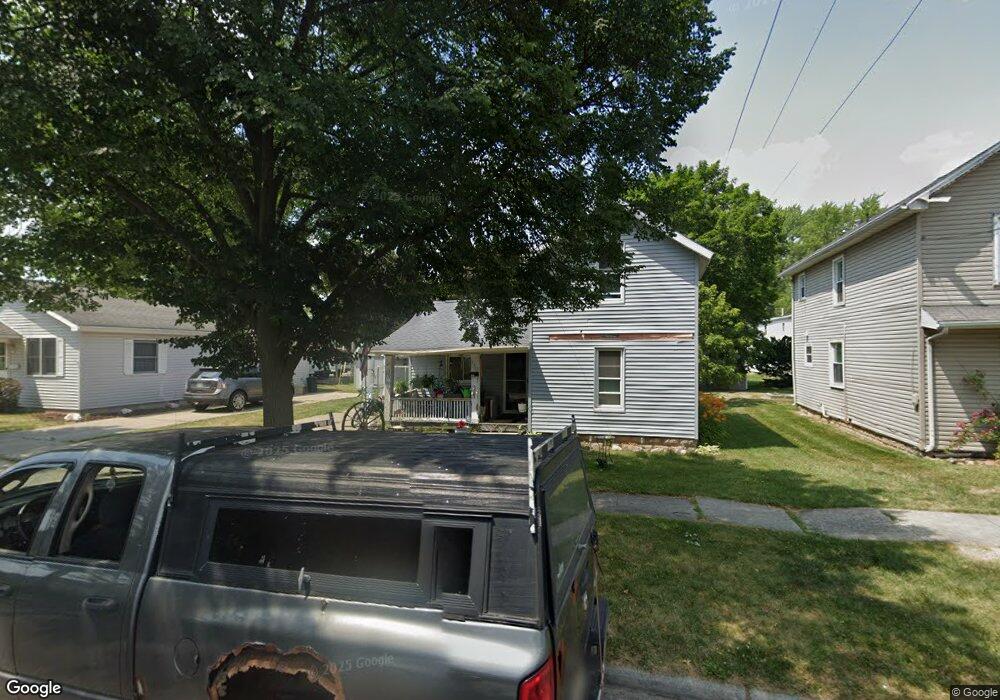
121 E Walnut St Wauseon, OH 43567
Estimated Value: $93,000 - $161,000
3
Beds
1
Bath
758
Sq Ft
$148/Sq Ft
Est. Value
About This Home
This home is located at 121 E Walnut St, Wauseon, OH 43567 and is currently estimated at $112,532, approximately $148 per square foot. 121 E Walnut St is a home located in Fulton County with nearby schools including Wauseon Primary School, Wauseon Elementary School, and Wauseon Middle School.
Ownership History
Date
Name
Owned For
Owner Type
Purchase Details
Closed on
Nov 8, 2017
Sold by
Baumer Luane and Simon Susan
Bought by
Whitten Richard D and Whitten Corey R
Current Estimated Value
Home Financials for this Owner
Home Financials are based on the most recent Mortgage that was taken out on this home.
Original Mortgage
$33,000
Outstanding Balance
$27,652
Interest Rate
3.85%
Mortgage Type
New Conventional
Estimated Equity
$84,880
Purchase Details
Closed on
Apr 23, 1996
Sold by
Green Harold W
Bought by
Whitten William and Whitten Ruth
Home Financials for this Owner
Home Financials are based on the most recent Mortgage that was taken out on this home.
Original Mortgage
$39,700
Interest Rate
7.44%
Mortgage Type
New Conventional
Purchase Details
Closed on
Jan 1, 1990
Bought by
Green Harold W
Create a Home Valuation Report for This Property
The Home Valuation Report is an in-depth analysis detailing your home's value as well as a comparison with similar homes in the area
Home Values in the Area
Average Home Value in this Area
Purchase History
| Date | Buyer | Sale Price | Title Company |
|---|---|---|---|
| Whitten Richard D | $20,000 | None Available | |
| Whitten William | $29,500 | -- | |
| Green Harold W | -- | -- |
Source: Public Records
Mortgage History
| Date | Status | Borrower | Loan Amount |
|---|---|---|---|
| Open | Whitten Richard D | $33,000 | |
| Previous Owner | Whitten William | $39,700 |
Source: Public Records
Tax History
| Year | Tax Paid | Tax Assessment Tax Assessment Total Assessment is a certain percentage of the fair market value that is determined by local assessors to be the total taxable value of land and additions on the property. | Land | Improvement |
|---|---|---|---|---|
| 2024 | $1,147 | $23,310 | $8,050 | $15,260 |
| 2023 | $1,184 | $23,310 | $8,050 | $15,260 |
| 2022 | $1,078 | $18,030 | $6,720 | $11,310 |
| 2021 | $1,159 | $18,030 | $6,720 | $11,310 |
| 2020 | $1,062 | $18,030 | $6,720 | $11,310 |
| 2019 | $969 | $16,210 | $5,880 | $10,330 |
| 2018 | $622 | $16,210 | $5,880 | $10,330 |
| 2017 | $613 | $16,210 | $5,880 | $10,330 |
| 2016 | $330 | $14,530 | $5,880 | $8,650 |
| 2015 | $307 | $14,530 | $5,880 | $8,650 |
| 2014 | $295 | $14,530 | $5,880 | $8,650 |
| 2013 | $124 | $11,030 | $5,290 | $5,740 |
Source: Public Records
Map
Nearby Homes
- 212 Jefferson St
- 203 E Oak St
- 316 E Oak St
- 351 E Walnut St
- 252 W Chestnut St
- 231 W Chestnut St
- 263 W Chestnut St
- 594 Douglas Dr
- 420 Clover Ln
- 744 Fairway Dr Unit 29
- 744 Fairway Dr Unit 26
- 749 Parkside Dr
- 1338 N Park Ln
- 1066 Seneca Dr
- 1062 Seneca Dr
- 1090 Seneca Dr
- 1171 Apache Dr
- 460 Airport Hwy
- 940 Fairway Ln
- 14578 Us Highway 20a
Your Personal Tour Guide
Ask me questions while you tour the home.