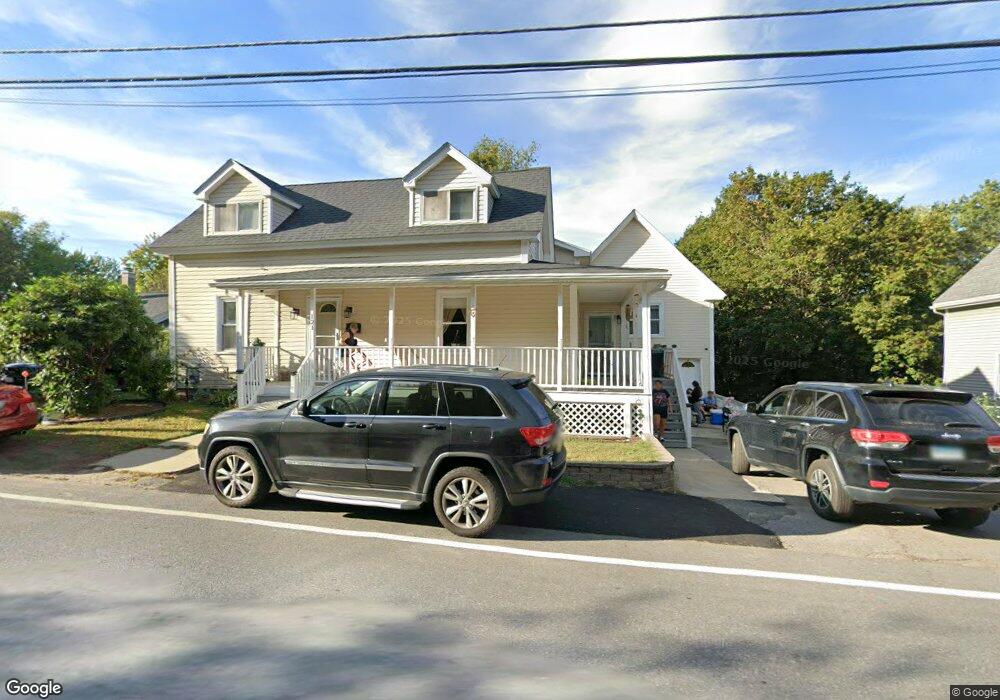
121 Elm St Leominster, MA 01453
Estimated Value: $451,000 - $531,570
4
Beds
3
Baths
2,371
Sq Ft
$207/Sq Ft
Est. Value
About This Home
This home is located at 121 Elm St, Leominster, MA 01453 and is currently estimated at $491,143, approximately $207 per square foot. 121 Elm St is a home located in Worcester County with nearby schools including Leominster High School, St. Leo School, and St. Anna Catholic School.
Ownership History
Date
Name
Owned For
Owner Type
Purchase Details
Closed on
Nov 3, 2004
Sold by
Alaska Seaboard Partne
Bought by
Rivera Aida L and Rivera Manuel
Current Estimated Value
Home Financials for this Owner
Home Financials are based on the most recent Mortgage that was taken out on this home.
Original Mortgage
$218,500
Outstanding Balance
$108,530
Interest Rate
5.71%
Mortgage Type
Purchase Money Mortgage
Estimated Equity
$382,613
Create a Home Valuation Report for This Property
The Home Valuation Report is an in-depth analysis detailing your home's value as well as a comparison with similar homes in the area
Home Values in the Area
Average Home Value in this Area
Purchase History
| Date | Buyer | Sale Price | Title Company |
|---|---|---|---|
| Rivera Aida L | $230,000 | -- | |
| Alaska Seaboard Lp | -- | -- | |
| Rivera Aida L | $230,000 | -- |
Source: Public Records
Mortgage History
| Date | Status | Borrower | Loan Amount |
|---|---|---|---|
| Open | Alaska Seaboard Lp | $218,500 | |
| Closed | Rivera Aida L | $218,500 | |
| Previous Owner | Rivera Aida L | $201,000 |
Source: Public Records
Tax History Compared to Growth
Tax History
| Year | Tax Paid | Tax Assessment Tax Assessment Total Assessment is a certain percentage of the fair market value that is determined by local assessors to be the total taxable value of land and additions on the property. | Land | Improvement |
|---|---|---|---|---|
| 2025 | $5,810 | $414,100 | $125,800 | $288,300 |
| 2024 | $5,585 | $384,900 | $119,800 | $265,100 |
| 2023 | $5,399 | $347,400 | $104,200 | $243,200 |
| 2022 | $5,193 | $313,600 | $90,600 | $223,000 |
| 2021 | $19 | $301,300 | $70,500 | $230,800 |
| 2020 | $5,351 | $297,600 | $70,500 | $227,100 |
| 2019 | $0 | $276,600 | $67,100 | $209,500 |
| 2018 | $3,585 | $237,500 | $65,100 | $172,400 |
| 2017 | $4,485 | $227,300 | $60,800 | $166,500 |
| 2016 | $4,182 | $213,600 | $60,800 | $152,800 |
| 2015 | $4,001 | $205,800 | $60,800 | $145,000 |
| 2014 | $3,708 | $196,300 | $67,400 | $128,900 |
Source: Public Records
Map
Nearby Homes