121 Fawn Meadow Dr Dripping Springs, TX 78620
Estimated Value: $682,000 - $1,080,104
3
Beds
3
Baths
2,120
Sq Ft
$438/Sq Ft
Est. Value
About This Home
This home is located at 121 Fawn Meadow Dr, Dripping Springs, TX 78620 and is currently estimated at $929,035, approximately $438 per square foot. 121 Fawn Meadow Dr is a home located in Hays County with nearby schools including Dripping Springs Middle School, Dripping Springs High School, and Acton Academy Dripping Springs.
Ownership History
Date
Name
Owned For
Owner Type
Purchase Details
Closed on
Nov 20, 2017
Sold by
Richardson Paula Jean and Richardson Elvie Louis
Bought by
J J Reid Enterprises Llc
Current Estimated Value
Home Financials for this Owner
Home Financials are based on the most recent Mortgage that was taken out on this home.
Original Mortgage
$204,000
Outstanding Balance
$170,942
Interest Rate
3.85%
Estimated Equity
$758,093
Purchase Details
Closed on
Jun 8, 2009
Sold by
Windham Laurie
Bought by
Reid James P and Reid Jennifer L
Home Financials for this Owner
Home Financials are based on the most recent Mortgage that was taken out on this home.
Original Mortgage
$250,000
Interest Rate
4.7%
Mortgage Type
Purchase Money Mortgage
Purchase Details
Closed on
Nov 14, 2006
Sold by
Robinson James R and Robinson Brenda H
Bought by
Windham Laurie
Purchase Details
Closed on
Jun 1, 2001
Sold by
Bohannon Clyde C and Bohannon Thora
Bought by
Reid James P and Reid Jennifer L
Create a Home Valuation Report for This Property
The Home Valuation Report is an in-depth analysis detailing your home's value as well as a comparison with similar homes in the area
Home Values in the Area
Average Home Value in this Area
Purchase History
| Date | Buyer | Sale Price | Title Company |
|---|---|---|---|
| J J Reid Enterprises Llc | -- | None Available | |
| Reid James P | -- | Independence Title | |
| Windham Laurie | -- | None Available | |
| Reid James P | -- | -- |
Source: Public Records
Mortgage History
| Date | Status | Borrower | Loan Amount |
|---|---|---|---|
| Open | J J Reid Enterprises Llc | $204,000 | |
| Previous Owner | Reid James P | $250,000 |
Source: Public Records
Tax History Compared to Growth
Tax History
| Year | Tax Paid | Tax Assessment Tax Assessment Total Assessment is a certain percentage of the fair market value that is determined by local assessors to be the total taxable value of land and additions on the property. | Land | Improvement |
|---|---|---|---|---|
| 2025 | $7,982 | $588,540 | -- | -- |
| 2024 | $7,982 | $592,350 | $753,030 | $466,530 |
| 2023 | $8,810 | $583,459 | $753,030 | $628,090 |
| 2022 | $9,047 | $530,417 | $247,000 | $333,880 |
| 2021 | $9,021 | $482,197 | $247,000 | $305,550 |
| 2020 | $7,659 | $438,361 | $74,050 | $376,810 |
| 2019 | $8,218 | $398,510 | $61,150 | $337,360 |
| 2018 | $7,905 | $381,190 | $61,150 | $320,040 |
| 2017 | $7,800 | $373,310 | $61,150 | $312,160 |
| 2016 | $7,439 | $356,010 | $61,150 | $294,860 |
| 2015 | $6,395 | $341,840 | $61,150 | $280,690 |
Source: Public Records
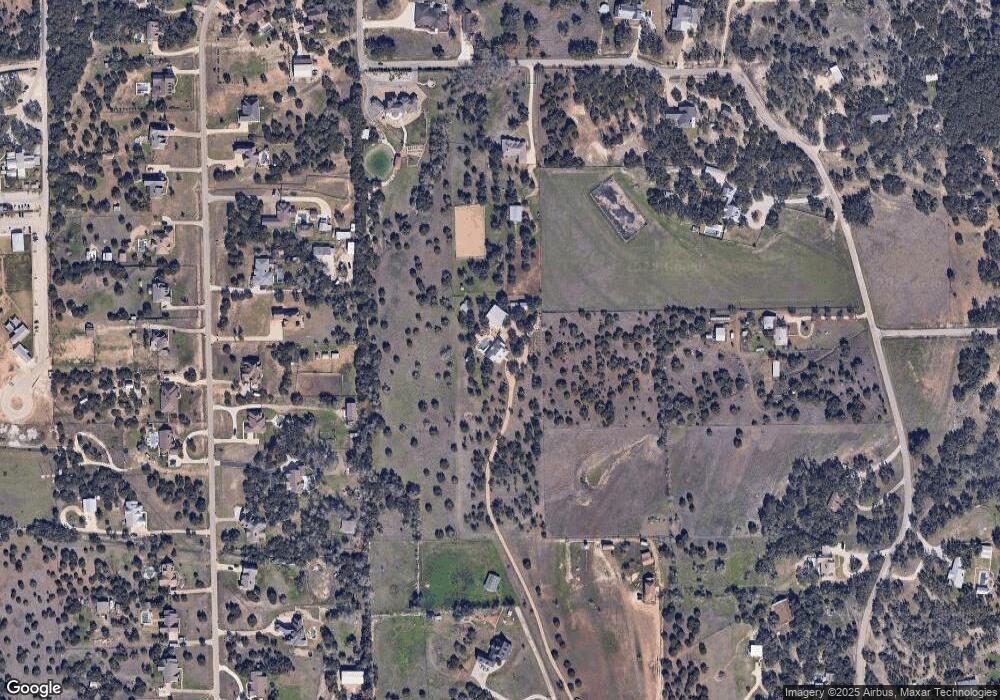
Map
Nearby Homes
- 1440 Deerfield Rd
- 220 Fawn Meadow Dr
- 351 Fawn Meadow Dr
- 724 Chama Trace
- 601 Hays Country Acres Rd
- 2450 E Creek Cove
- 550 Hays Country Acres Rd
- 294 Frog Pond Ln
- 1021 Westland Ridge Rd
- 1006 Foothills Dr
- 1120 Canyon View Rd
- 220 Lanier Ranch Rd
- 211 E Creek Dr
- 816 Drifting Wind Run
- 907 Iron Willow Loop
- 843 Iron Willow Loop
- 798 Iron Willow Loop
- 1305 Park Cove
- 201 N Canyonwood Dr
- 1026 Canyon Bend Dr
- 1330 Deerfield Rd
- 419 Chama Trace
- 453 Chama Trace
- 485 Chama Trace
- 353 Chama Trace
- 1550 Deerfield Rd
- 519 Chama Trace
- 151 Fawn Meadow Dr
- 1660 Deerfield Rd
- 101 Fawn Meadow Dr
- 551 Chama Trace
- TBD - lot 3 Deerfield Rd
- TBD Lot 3 Deerfield Rd
- TBD - lot 4 Deerfield Rd
- TBD Lot 4 Deerfield Rd
- TBD Lot 5 Deerfield Rd
- 317 Chama Trace
- TBD - Lot 1 Deerfield Rd
- TBD Deerfield Rd