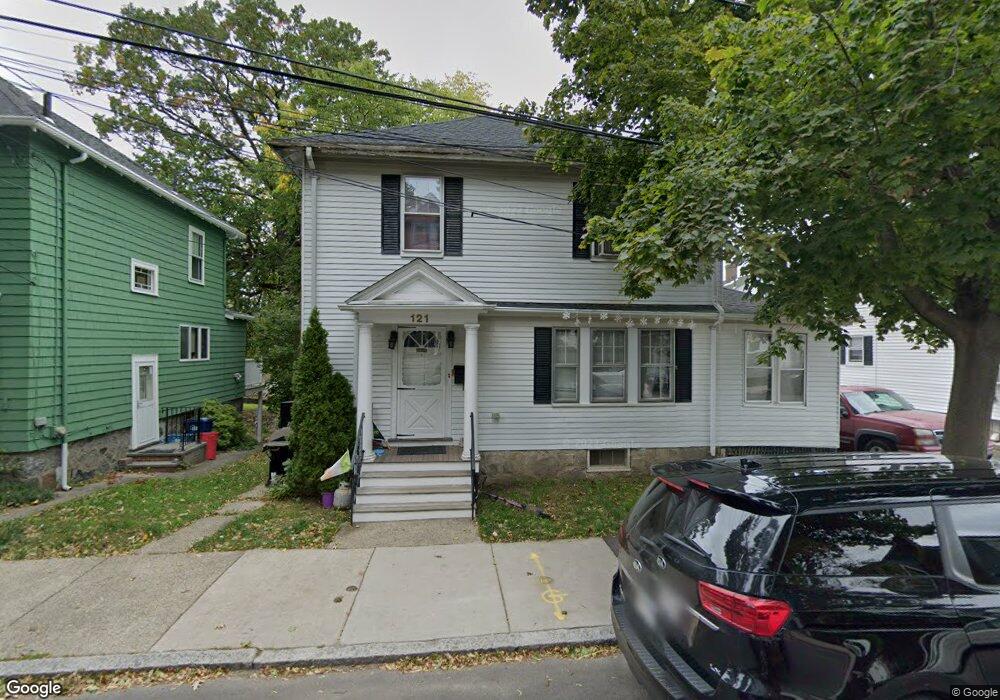
121 Fletcher St West Roxbury, MA 02132
West Roxbury NeighborhoodEstimated Value: $713,000 - $819,000
3
Beds
1
Bath
1,404
Sq Ft
$536/Sq Ft
Est. Value
About This Home
This home is located at 121 Fletcher St, West Roxbury, MA 02132 and is currently estimated at $752,692, approximately $536 per square foot. 121 Fletcher St is a home located in Suffolk County with nearby schools including Brooke Charter School Roslindale, Holy Name Parish School, and St. Clare High School.
Ownership History
Date
Name
Owned For
Owner Type
Purchase Details
Closed on
Nov 20, 1992
Sold by
Omalley Michael and Omalley Maria C
Bought by
Mannion Thomas J
Current Estimated Value
Home Financials for this Owner
Home Financials are based on the most recent Mortgage that was taken out on this home.
Original Mortgage
$100,000
Interest Rate
7.95%
Mortgage Type
Purchase Money Mortgage
Create a Home Valuation Report for This Property
The Home Valuation Report is an in-depth analysis detailing your home's value as well as a comparison with similar homes in the area
Home Values in the Area
Average Home Value in this Area
Purchase History
| Date | Buyer | Sale Price | Title Company |
|---|---|---|---|
| Mannion Thomas J | $137,500 | -- |
Source: Public Records
Mortgage History
| Date | Status | Borrower | Loan Amount |
|---|---|---|---|
| Open | Mannion Thomas J | $81,300 | |
| Closed | Mannion Thomas J | $100,000 |
Source: Public Records
Tax History Compared to Growth
Tax History
| Year | Tax Paid | Tax Assessment Tax Assessment Total Assessment is a certain percentage of the fair market value that is determined by local assessors to be the total taxable value of land and additions on the property. | Land | Improvement |
|---|---|---|---|---|
| 2025 | $7,178 | $619,900 | $185,900 | $434,000 |
| 2024 | $6,097 | $559,400 | $192,200 | $367,200 |
| 2023 | $5,720 | $532,600 | $183,000 | $349,600 |
| 2022 | $5,315 | $488,500 | $167,900 | $320,600 |
| 2021 | $4,837 | $453,300 | $161,400 | $291,900 |
| 2020 | $4,562 | $432,000 | $145,200 | $286,800 |
| 2019 | $4,253 | $403,500 | $124,700 | $278,800 |
| 2018 | $4,027 | $384,300 | $124,700 | $259,600 |
| 2017 | $4,028 | $380,400 | $124,700 | $255,700 |
| 2016 | $3,978 | $361,600 | $124,700 | $236,900 |
| 2015 | $4,232 | $349,500 | $130,200 | $219,300 |
| 2014 | $4,067 | $323,300 | $130,200 | $193,100 |
Source: Public Records
Map
Nearby Homes
- 26 Bradfield Ave Unit 3
- 87 Knoll St
- 24 Hazelmere Rd
- 257 Belgrade Ave
- 79 Robert St Unit 3
- 242 Belgrade Ave
- 15 Newburg St Unit 1
- 311 Belgrade Ave
- 10 Burwell Rd
- 103 Belgrade Ave Unit 2
- 17 Metcalf St
- 15 S Fairview St Unit 3
- 10 Hackensack Terrace
- 2 Weld Hill St Unit PH2
- 95 Newburg St
- 214 Allandale Rd Unit B
- 80 Roslindale Ave Unit 3
- 65 Birch St Unit 3
- 206 Allandale Rd Unit 3C
- 112 Roslindale Ave Unit 2
- 125 Fletcher St
- 119 Fletcher St
- 1497 Centre St
- 91 Montclair Ave
- 87 Montclair Ave
- 87 Montclair Ave Unit 2
- 87 Montclair Ave Unit 1
- 114 Fletcher St
- 1489 Centre St
- 1487 Centre St
- 1487 Centre St Unit 2
- 81 Montclair Ave
- 95 Montclair Ave
- 1515 Centre St
- 1515 Centre St Unit 2
- 1515 Centre St Unit 1
- 75 Montclair Ave
- 99 Montclair Ave
- 1481 Centre St
- 1504 Centre St