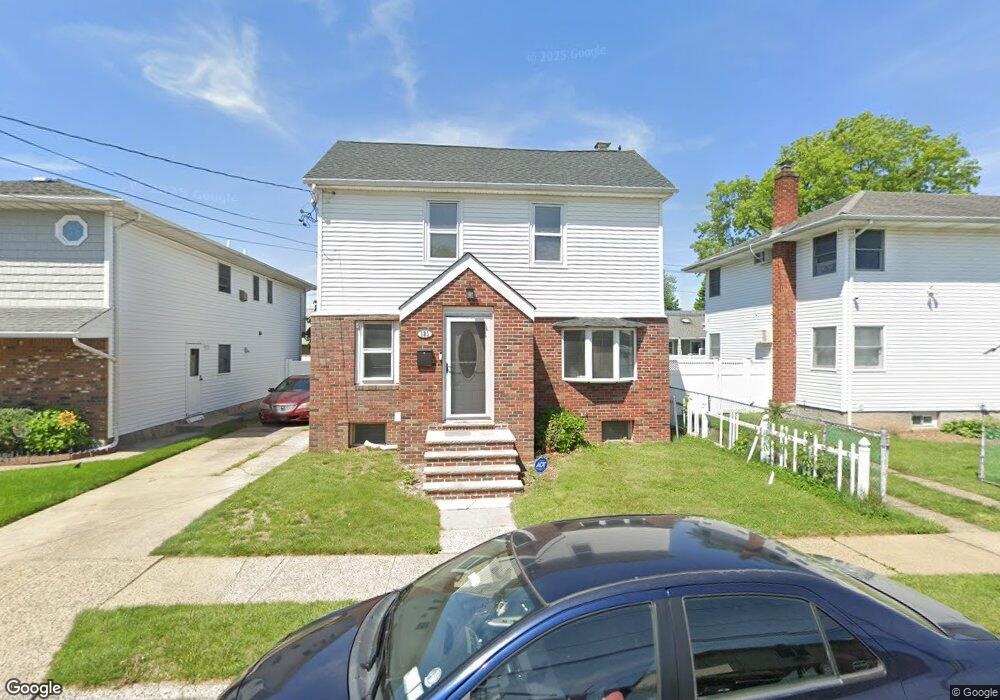
121 Franklin St Franklin Square, NY 11010
Estimated Value: $512,000 - $713,658
--
Bed
1
Bath
1,176
Sq Ft
$521/Sq Ft
Est. Value
About This Home
This home is located at 121 Franklin St, Franklin Square, NY 11010 and is currently estimated at $612,829, approximately $521 per square foot. 121 Franklin St is a home located in Nassau County with nearby schools including St Anne's School.
Ownership History
Date
Name
Owned For
Owner Type
Purchase Details
Closed on
Jul 11, 2023
Sold by
U S Bank National Association and The Rmac Trust Series 2016 Ctt
Bought by
Harney Latisha
Current Estimated Value
Home Financials for this Owner
Home Financials are based on the most recent Mortgage that was taken out on this home.
Original Mortgage
$384,800
Interest Rate
6.96%
Mortgage Type
New Conventional
Purchase Details
Closed on
Feb 15, 2023
Sold by
Bourke Peter and Bourke Elaine M
Bought by
U S Bank National Association and Rmac Trust Series 2016 Ctt
Purchase Details
Closed on
Mar 16, 2004
Sold by
Lepre Biagio
Bought by
Bourke Peter
Purchase Details
Closed on
Jun 7, 1996
Sold by
Lepre Benito and Lepre Josephine
Bought by
Lepre Biagio
Home Financials for this Owner
Home Financials are based on the most recent Mortgage that was taken out on this home.
Original Mortgage
$70,000
Interest Rate
7.97%
Mortgage Type
Purchase Money Mortgage
Create a Home Valuation Report for This Property
The Home Valuation Report is an in-depth analysis detailing your home's value as well as a comparison with similar homes in the area
Home Values in the Area
Average Home Value in this Area
Purchase History
| Date | Buyer | Sale Price | Title Company |
|---|---|---|---|
| Harney Latisha | $481,000 | Old Republic Natl Ttl Ins Co | |
| Harney Latisha | $481,000 | Old Republic Natl Ttl Ins Co | |
| Harney Latisha | $481,000 | Old Republic Natl Ttl Ins Co | |
| Harney Latisha | $481,000 | Old Republic Natl Ttl Ins Co | |
| U S Bank National Association | $440,123 | Web Title | |
| U S Bank National Association | $440,123 | Web Title | |
| U S Bank National Association | $440,123 | Web Title | |
| Bourke Peter | $345,000 | -- | |
| Bourke Peter | $345,000 | -- | |
| Lepre Biagio | $83,000 | -- | |
| Lepre Biagio | $83,000 | -- |
Source: Public Records
Mortgage History
| Date | Status | Borrower | Loan Amount |
|---|---|---|---|
| Previous Owner | Harney Latisha | $384,800 | |
| Previous Owner | Lepre Biagio | $70,000 |
Source: Public Records
Tax History Compared to Growth
Tax History
| Year | Tax Paid | Tax Assessment Tax Assessment Total Assessment is a certain percentage of the fair market value that is determined by local assessors to be the total taxable value of land and additions on the property. | Land | Improvement |
|---|---|---|---|---|
| 2025 | $10,188 | $468 | $215 | $253 |
| 2024 | $4,207 | $468 | $215 | $253 |
| 2023 | $9,606 | $468 | $215 | $253 |
| 2022 | $9,606 | $468 | $215 | $253 |
| 2021 | $12,959 | $459 | $211 | $248 |
| 2020 | $10,748 | $774 | $484 | $290 |
| 2019 | $10,968 | $774 | $484 | $290 |
| 2018 | $10,349 | $774 | $0 | $0 |
| 2017 | $5,404 | $774 | $484 | $290 |
| 2016 | $9,321 | $774 | $484 | $290 |
| 2015 | $3,660 | $774 | $484 | $290 |
| 2014 | $3,660 | $774 | $484 | $290 |
| 2013 | $3,417 | $774 | $484 | $290 |
Source: Public Records
Map
Nearby Homes
- 115 Madison Ave
- 166 Franklin St
- 78 New Hyde Park Rd
- 32 Madison Ave
- 23 Monroe St
- 215 Harrison Ave
- 51 Pacific St
- 235 Lincoln Place
- 170 Mckinley Ave
- 775 Roosevelt St
- 31 Claflin Blvd
- 182 Lexington Ave
- 62 Herman Blvd
- 1041 Russell St
- 715 Iris St
- 1022 Rosegold St
- 888 Court Rd
- 109 Caroline Ave
- 163 Herman Blvd
- 1098 Russell St
- 121 Franklin St
- 117 Franklin St
- 925 Garfield St
- 115 Franklin St
- 42 Courthouse Rd
- 933 Garfield St
- 919 Garfield St
- 118 Courthouse Rd
- 136 Franklin St
- 120 Franklin St
- 116 Franklin St
- 915 Garfield St
- 107 Franklin St
- 107 Franklin St Unit 2nd Fl
- 112 Franklin St
- 112 Courthouse Rd
- 930 Garfield St
- 909 Garfield St
- 106 Franklin St
- 108 Courthouse Rd