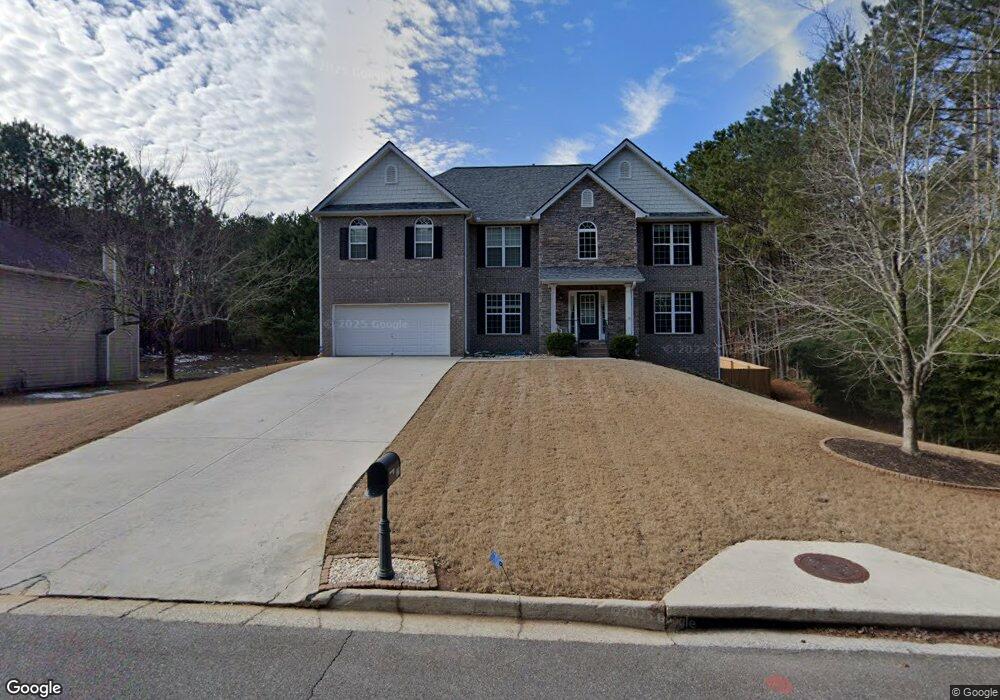
121 Hickory Branch Dr Acworth, GA 30101
Cedarcrest NeighborhoodEstimated Value: $443,000 - $514,000
4
Beds
3
Baths
4,712
Sq Ft
$103/Sq Ft
Est. Value
About This Home
This home is located at 121 Hickory Branch Dr, Acworth, GA 30101 and is currently estimated at $486,622, approximately $103 per square foot. 121 Hickory Branch Dr is a home located in Paulding County with nearby schools including Roland W. Russom Elementary School, East Paulding Middle School, and North Paulding High School.
Ownership History
Date
Name
Owned For
Owner Type
Purchase Details
Closed on
Nov 23, 2011
Sold by
Dover Tommy and Dover Mary
Current Estimated Value
Home Financials for this Owner
Home Financials are based on the most recent Mortgage that was taken out on this home.
Original Mortgage
$136,000
Outstanding Balance
$93,319
Interest Rate
4.15%
Mortgage Type
New Conventional
Estimated Equity
$393,303
Purchase Details
Closed on
Apr 21, 2006
Sold by
Dover Tommy
Bought by
Dover Tommy and Dover Mary
Home Financials for this Owner
Home Financials are based on the most recent Mortgage that was taken out on this home.
Original Mortgage
$12,100
Interest Rate
6%
Mortgage Type
New Conventional
Create a Home Valuation Report for This Property
The Home Valuation Report is an in-depth analysis detailing your home's value as well as a comparison with similar homes in the area
Home Values in the Area
Average Home Value in this Area
Purchase History
| Date | Buyer | Sale Price | Title Company |
|---|---|---|---|
| -- | $170,000 | -- | |
| Monte Christopher | $170,000 | -- | |
| Monte Jane F | $170,000 | -- | |
| Dover Tommy | -- | -- |
Source: Public Records
Mortgage History
| Date | Status | Borrower | Loan Amount |
|---|---|---|---|
| Open | Monte Jane F | $136,000 | |
| Closed | Monte Christopher | $136,000 | |
| Previous Owner | Dover Tommy | $12,100 |
Source: Public Records
Tax History Compared to Growth
Tax History
| Year | Tax Paid | Tax Assessment Tax Assessment Total Assessment is a certain percentage of the fair market value that is determined by local assessors to be the total taxable value of land and additions on the property. | Land | Improvement |
|---|---|---|---|---|
| 2024 | $3,755 | $165,720 | $14,000 | $151,720 |
| 2023 | $3,595 | $151,668 | $14,000 | $137,668 |
| 2022 | $3,298 | $137,760 | $14,000 | $123,760 |
| 2021 | $3,307 | $124,960 | $14,000 | $110,960 |
| 2020 | $2,949 | $110,400 | $14,000 | $96,400 |
| 2019 | $3,021 | $111,400 | $14,000 | $97,400 |
| 2018 | $3,175 | $107,240 | $14,000 | $93,240 |
| 2017 | $2,363 | $79,200 | $14,000 | $65,200 |
| 2016 | $2,201 | $74,640 | $14,000 | $60,640 |
| 2015 | $2,734 | $90,680 | $14,000 | $76,680 |
| 2014 | $2,645 | $85,640 | $14,000 | $71,640 |
| 2013 | -- | $60,120 | $14,000 | $46,120 |
Source: Public Records
Map
Nearby Homes
- 0 Hickory Branch Dr Unit 7169723
- 0 Hickory Branch Dr Unit 7066174
- 0 Hickory Branch Dr Unit 7049198
- 0 Hickory Branch Dr Unit 3229027
- 0 Hickory Branch Dr Unit 8731690
- 0 Hickory Branch Dr Unit 8166344
- 0 Hickory Branch Dr Unit 8133365
- 0 Hickory Branch Dr Unit 7168178
- 101 Hickory Branch Dr
- 85 Hickory Branch Dr
- 33 Hickory Creek Ln
- 158 Hickory Branch Dr
- 67 Hickory Branch Dr
- 23 Hickory Creek Ln
- 174 Hickory Branch Dr
- 62 Hickory Branch Dr
- 223 Hickory Branch Dr
- 40 Creekview Ct
- 1961 Seymour Dr NW
- 194 Hickory Branch Dr