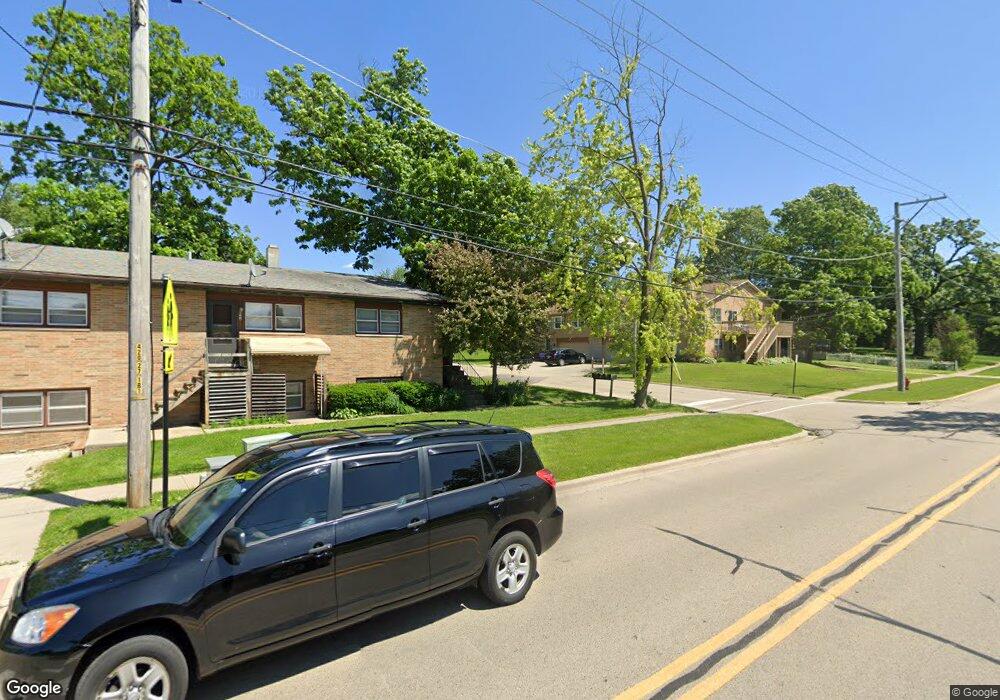
121 High Ave Hampshire, IL 60140
Estimated Value: $468,000 - $531,000
6
Beds
3
Baths
3,041
Sq Ft
$161/Sq Ft
Est. Value
About This Home
This home is located at 121 High Ave, Hampshire, IL 60140 and is currently estimated at $488,653, approximately $160 per square foot. 121 High Ave is a home located in Kane County with nearby schools including Hampshire Elementary School, Hampshire Middle School, and Hampshire High School.
Ownership History
Date
Name
Owned For
Owner Type
Purchase Details
Closed on
Jul 7, 2017
Sold by
Panma Properties Llc
Bought by
Pirtle Brian and Gebben Matthew
Current Estimated Value
Home Financials for this Owner
Home Financials are based on the most recent Mortgage that was taken out on this home.
Original Mortgage
$221,250
Outstanding Balance
$188,003
Interest Rate
4.75%
Mortgage Type
New Conventional
Estimated Equity
$300,650
Purchase Details
Closed on
May 21, 2015
Sold by
Herrmann Charles A
Bought by
Panama Properties Llc
Home Financials for this Owner
Home Financials are based on the most recent Mortgage that was taken out on this home.
Original Mortgage
$161,250
Interest Rate
3.63%
Mortgage Type
Future Advance Clause Open End Mortgage
Purchase Details
Closed on
May 8, 2008
Sold by
Herrmann Charles A and Herrmann Sharon K
Bought by
Herrmann Charles A and Herrmann Sharon K
Purchase Details
Closed on
Nov 22, 2004
Sold by
First American Bank
Bought by
Herrmann Charles A and Herrmann Sharon
Create a Home Valuation Report for This Property
The Home Valuation Report is an in-depth analysis detailing your home's value as well as a comparison with similar homes in the area
Home Values in the Area
Average Home Value in this Area
Purchase History
| Date | Buyer | Sale Price | Title Company |
|---|---|---|---|
| Pirtle Brian | $295,000 | Heritage Title Co | |
| Panama Properties Llc | $169,000 | Wheatland Title Guaranty | |
| Herrmann Charles A | -- | None Available | |
| Herrmann Charles A | -- | Chicago Title Insurance Comp |
Source: Public Records
Mortgage History
| Date | Status | Borrower | Loan Amount |
|---|---|---|---|
| Open | Pirtle Brian | $221,250 | |
| Previous Owner | Panama Properties Llc | $161,250 |
Source: Public Records
Tax History Compared to Growth
Tax History
| Year | Tax Paid | Tax Assessment Tax Assessment Total Assessment is a certain percentage of the fair market value that is determined by local assessors to be the total taxable value of land and additions on the property. | Land | Improvement |
|---|---|---|---|---|
| 2024 | $10,331 | $141,150 | $32,704 | $108,446 |
| 2023 | $9,929 | $126,968 | $29,418 | $97,550 |
| 2022 | $9,356 | $116,688 | $27,036 | $89,652 |
| 2021 | $8,956 | $110,544 | $25,503 | $85,041 |
| 2020 | $8,826 | $107,523 | $24,806 | $82,717 |
| 2019 | $8,721 | $104,008 | $23,995 | $80,013 |
| 2018 | $8,474 | $97,324 | $22,671 | $74,653 |
| 2017 | $8,563 | $97,022 | $21,774 | $75,248 |
| 2016 | $8,450 | $91,203 | $20,468 | $70,735 |
| 2015 | -- | $84,769 | $19,024 | $65,745 |
| 2014 | -- | $81,974 | $18,397 | $63,577 |
| 2013 | -- | $87,215 | $19,573 | $67,642 |
Source: Public Records
Map
Nearby Homes
- 704 S State St
- 895 S State St
- 190 Grove Ave
- 263 E Jackson Ave
- 318 Old Mill Ln
- 862 Briar Glen Ct
- 804 Briar Glen Ct
- 820 Briar Glen Ct
- 120 Jack Dylan Dr
- 125 Mill Ave
- LOT 37 W Oak Knoll Dr
- 602 Woodside Terrace
- Lot 0 N State St
- 1655 Windsor Rd
- 730 Bruce Dr
- 431 Patricia Ln
- 720 James Dr
- 808 James Dr
- 286 Wild Prairie Pointe
- 284 Wild Prairie Pointe