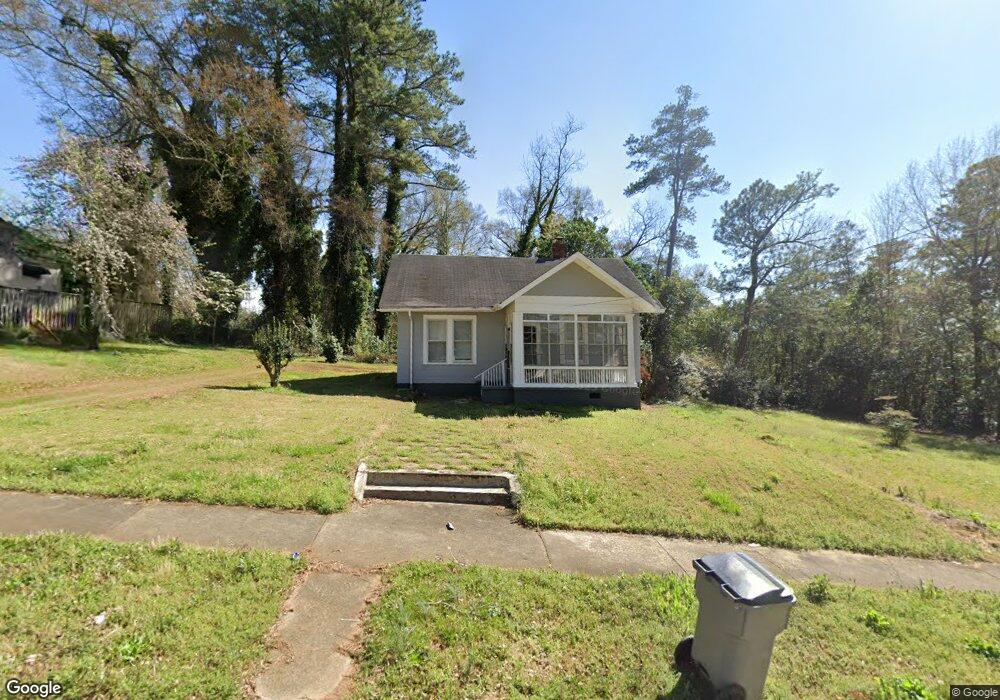
121 Highland Ave Lagrange, GA 30240
Estimated Value: $94,000 - $138,293
2
Beds
1
Bath
1,296
Sq Ft
$91/Sq Ft
Est. Value
About This Home
This home is located at 121 Highland Ave, Lagrange, GA 30240 and is currently estimated at $117,823, approximately $90 per square foot. 121 Highland Ave is a home located in Troup County with nearby schools including Franklin Forest Elementary School, Hollis Hand Elementary School, and Ethel W. Kight Elementary School.
Ownership History
Date
Name
Owned For
Owner Type
Purchase Details
Closed on
Aug 12, 2016
Sold by
William T
Bought by
Hameed Abid
Current Estimated Value
Purchase Details
Closed on
Oct 7, 1983
Sold by
Steelmon Joyce A Interest
Bought by
William William T and William Joyce S
Purchase Details
Closed on
Jun 21, 1983
Sold by
Gay Towns T and Gay Joyce A
Bought by
Steelmon Joyce A Interest
Purchase Details
Closed on
Apr 25, 1983
Sold by
Rogers Fredrick P and Rogers Jamine C
Bought by
Gay Towns T and Gay Joyce A
Purchase Details
Closed on
Jan 20, 1978
Sold by
Sauter Doris C
Bought by
Rogers Fredrick P and Rogers Jamine C
Purchase Details
Closed on
Jan 1, 1973
Sold by
Hammett Louise B
Bought by
Sauter Doris C
Purchase Details
Closed on
Jan 1, 1972
Sold by
Pattillo Joe L
Bought by
Hammett Louise B
Purchase Details
Closed on
Jul 1, 1965
Sold by
Prather Annie B
Bought by
Pattillo Joe L
Create a Home Valuation Report for This Property
The Home Valuation Report is an in-depth analysis detailing your home's value as well as a comparison with similar homes in the area
Home Values in the Area
Average Home Value in this Area
Purchase History
| Date | Buyer | Sale Price | Title Company |
|---|---|---|---|
| Hameed Abid | $33,000 | -- | |
| William William T | -- | -- | |
| Steelmon Joyce A Interest | $39,000 | -- | |
| Gay Towns T | $37,500 | -- | |
| Rogers Fredrick P | $23,500 | -- | |
| Sauter Doris C | $13,000 | -- | |
| Hammett Louise B | $10,000 | -- | |
| Pattillo Joe L | -- | -- |
Source: Public Records
Tax History Compared to Growth
Tax History
| Year | Tax Paid | Tax Assessment Tax Assessment Total Assessment is a certain percentage of the fair market value that is determined by local assessors to be the total taxable value of land and additions on the property. | Land | Improvement |
|---|---|---|---|---|
| 2024 | $903 | $33,120 | $5,360 | $27,760 |
| 2023 | $669 | $24,520 | $5,360 | $19,160 |
| 2022 | $653 | $23,400 | $5,360 | $18,040 |
| 2021 | $637 | $21,120 | $5,360 | $15,760 |
| 2020 | $637 | $21,120 | $5,360 | $15,760 |
| 2019 | $560 | $18,580 | $4,500 | $14,080 |
| 2018 | $560 | $18,580 | $4,500 | $14,080 |
| 2017 | $398 | $18,580 | $4,500 | $14,080 |
| 2016 | $539 | $17,873 | $4,500 | $13,373 |
| 2015 | $567 | $18,764 | $5,391 | $13,373 |
| 2014 | $547 | $18,060 | $5,391 | $12,669 |
| 2013 | -- | $19,289 | $5,264 | $14,025 |
Source: Public Records
Map
Nearby Homes
- 0 Ridley Ave Unit 10550104
- 609 Ridley Ave
- 707 Ridley Ave
- 611 Ridley Ave
- 615 Ridley Ave
- 709 Ridley Ave
- 219 Banks St
- 301 E Bacon St
- 109 Thomas St
- 408 Gordon St
- 105 Saynor Cir
- 600,606,608,616 S Harlem
- 206 Broad St
- 900 North St
- 109 Dogwood Dr
- 110 Russell St
- 145 Turner St
- 600 S Harlem Cir
- 706 N Harlem Cir
- 131 Foch St
- 125 Highland Ave
- 119 Highland Ave
- 127 Highland Ave
- 0 Highland Ave Unit 3258937
- 0 Highland Ave Unit 8409594
- 0 Highland Ave Unit 8353309
- 0 Highland Ave Unit 8073863
- 0 Highland Ave
- 117 Highland Ave
- 122 Highland Ave
- 120 Highland Ave
- 129 Highland Ave
- 109 Highland Ave
- 124 Highland Ave
- 126 Highland Ave
- 126 Highland Ave
- 118 Highland Ave
- 118 Highland Ave Unit 59
- 104 Marshall St
- 107 Highland Ave