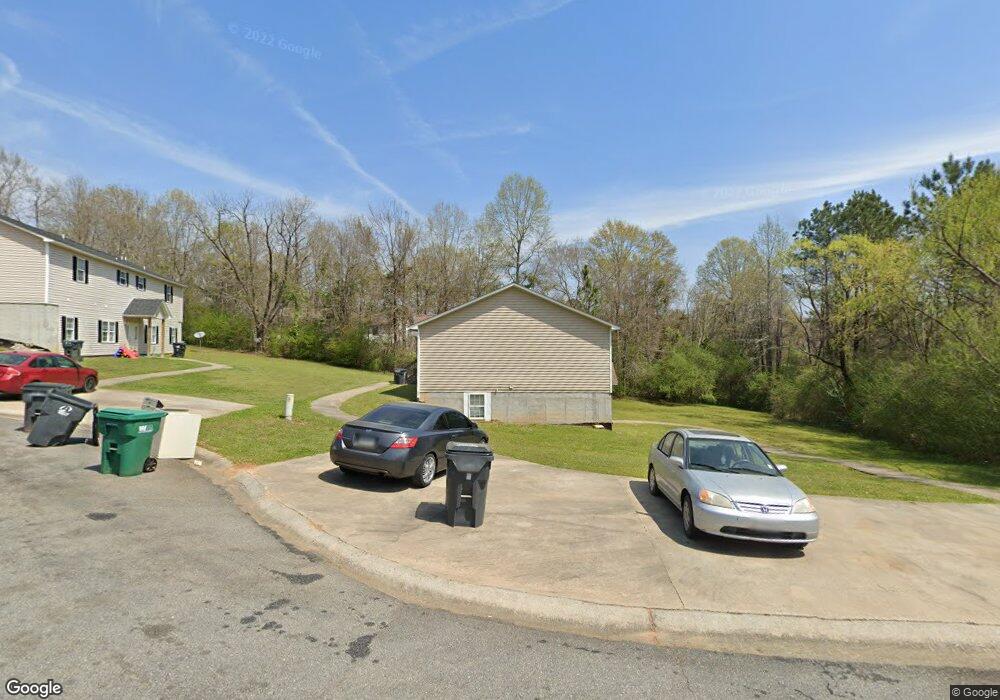
121 Irish Ln Milledgeville, GA 31061
Estimated Value: $268,000 - $351,000
--
Bed
8
Baths
3,522
Sq Ft
$89/Sq Ft
Est. Value
About This Home
This home is located at 121 Irish Ln, Milledgeville, GA 31061 and is currently estimated at $312,333, approximately $88 per square foot. 121 Irish Ln is a home located in Baldwin County with nearby schools including Lakeview Primary, Lakeview Academy, and Oak Hill Middle School.
Ownership History
Date
Name
Owned For
Owner Type
Purchase Details
Closed on
Sep 14, 2012
Sold by
Farmers State Bank
Bought by
Nyon Llc
Current Estimated Value
Home Financials for this Owner
Home Financials are based on the most recent Mortgage that was taken out on this home.
Original Mortgage
$141,914
Outstanding Balance
$23,730
Interest Rate
3.68%
Mortgage Type
New Conventional
Estimated Equity
$288,603
Purchase Details
Closed on
Apr 5, 2011
Sold by
Carr Rufus C
Bought by
Farmers State Bank
Purchase Details
Closed on
Jan 6, 2004
Sold by
Jrdc Rentals Llc
Bought by
Carr Rufus C
Purchase Details
Closed on
Mar 20, 2000
Sold by
Leslie John R
Bought by
Roberts Jimmy
Purchase Details
Closed on
Mar 17, 2000
Sold by
Bentley James M and Bentley Do
Bought by
Leslie John R
Purchase Details
Closed on
Nov 20, 1998
Sold by
Mcree Jerry
Bought by
Bentley James M and Bentley Do
Create a Home Valuation Report for This Property
The Home Valuation Report is an in-depth analysis detailing your home's value as well as a comparison with similar homes in the area
Home Values in the Area
Average Home Value in this Area
Purchase History
| Date | Buyer | Sale Price | Title Company |
|---|---|---|---|
| Nyon Llc | $140,000 | -- | |
| Farmers State Bank | -- | -- | |
| Farmers State Bank | -- | -- | |
| Carr Rufus C | $200,000 | -- | |
| Jrdc Rentals Llc | -- | -- | |
| Roberts Jimmy | $35,000 | -- | |
| Leslie John R | $42,000 | -- | |
| Bentley James M | $48,000 | -- |
Source: Public Records
Mortgage History
| Date | Status | Borrower | Loan Amount |
|---|---|---|---|
| Open | Nyon Llc | $141,914 |
Source: Public Records
Tax History Compared to Growth
Tax History
| Year | Tax Paid | Tax Assessment Tax Assessment Total Assessment is a certain percentage of the fair market value that is determined by local assessors to be the total taxable value of land and additions on the property. | Land | Improvement |
|---|---|---|---|---|
| 2025 | $3,417 | $95,908 | $3,840 | $92,068 |
| 2024 | $3,417 | $95,908 | $3,840 | $92,068 |
| 2023 | $1,792 | $71,812 | $3,200 | $68,612 |
| 2022 | $1,810 | $73,264 | $3,200 | $70,064 |
| 2021 | $1,271 | $48,320 | $3,200 | $45,120 |
| 2020 | $1,722 | $48,320 | $3,200 | $45,120 |
| 2019 | $1,256 | $48,320 | $3,200 | $45,120 |
| 2018 | $1,265 | $48,320 | $3,200 | $45,120 |
| 2017 | $1,591 | $62,400 | $3,200 | $59,200 |
| 2016 | $1,338 | $49,720 | $5,080 | $44,640 |
| 2015 | $1,340 | $49,720 | $5,080 | $44,640 |
| 2014 | $1,342 | $49,720 | $5,080 | $44,640 |
Source: Public Records
Map
Nearby Homes
- 1985 Briarcliff Rd
- 1985 Briarcliff Rd Unit A1
- 1985 Briarcliff Rd Unit B1
- 1756 Stone Meadow Rd
- 1835 Audobon Rd
- 122 Ivey Weaver Rd NE
- 1647 Valley Rd
- 1740 Holly Hill Rd
- 1863 Tanglewood Rd
- 261 Linda Dr NE
- 1605 Stone Meadow Rd
- 1692 Pine Valley Rd
- 240 Lakeside Dr
- 384 Grimes Ave
- 271 Lakeside Dr
- 1954 Twin Oaks Dr
- 1750 Elmwood Rd
- 1745 Cedarwood Rd
- 2275 Leo Ct
- 1784 Cedarwood Rd
- 131 Irish Ln Unit 37
- 131 Irish Ln
- 130 Shamrock Ln
- 1830 N Ridge Dr Unit B
- 1830 N Ridge Dr Unit C
- 140 Shamrock Ln
- 1840 N Ridge Dr
- 120 Shamrock Ln
- 141 Irish Ln
- 1820 N Ridge Dr
- 1820 N Ridge Dr Unit A
- 1820 N Ridge Dr Unit D
- 1820 N Ridge Dr Unit B
- 1820 N Ridge Dr Unit C
- 120 Irish Ln
- 140 Irish Ln
- 150 Shamrock Ln
- 110 Shamrock Ln
- 131 Shamrock Ln
- N N Ridge Dr Unit D