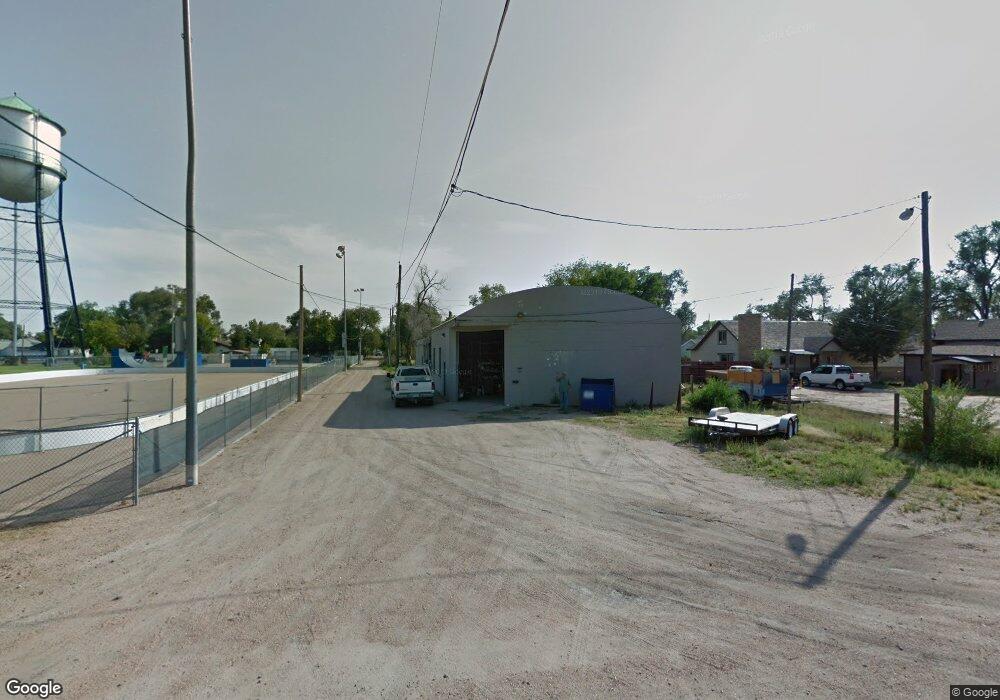
121 Jefferson St Sterling, CO 80751
Estimated Value: $106,665
--
Bed
--
Bath
4,537
Sq Ft
$24/Sq Ft
Est. Value
About This Home
This home is located at 121 Jefferson St, Sterling, CO 80751 and is currently estimated at $106,665, approximately $23 per square foot. 121 Jefferson St is a home located in Logan County with nearby schools including Campbell Elementary School, Ayres Elementary School, and Sterling Middle School.
Ownership History
Date
Name
Owned For
Owner Type
Purchase Details
Closed on
Jun 22, 2020
Sold by
R & T Enterprise Llc
Bought by
Jps Llc
Current Estimated Value
Home Financials for this Owner
Home Financials are based on the most recent Mortgage that was taken out on this home.
Original Mortgage
$57,750
Outstanding Balance
$40,598
Interest Rate
3.2%
Mortgage Type
Future Advance Clause Open End Mortgage
Estimated Equity
$66,067
Purchase Details
Closed on
Dec 28, 2012
Sold by
Phipps Electric Llp
Bought by
R & T Enterprise Llc
Purchase Details
Closed on
Apr 14, 2005
Sold by
Maricks Waste Disposal Inc
Bought by
Phipps Electric Llp
Home Financials for this Owner
Home Financials are based on the most recent Mortgage that was taken out on this home.
Original Mortgage
$20,000
Interest Rate
12%
Mortgage Type
Seller Take Back
Create a Home Valuation Report for This Property
The Home Valuation Report is an in-depth analysis detailing your home's value as well as a comparison with similar homes in the area
Home Values in the Area
Average Home Value in this Area
Purchase History
| Date | Buyer | Sale Price | Title Company |
|---|---|---|---|
| Jps Llc | $77,000 | Stewart Title | |
| R & T Enterprise Llc | $50,000 | Stewart Title | |
| Phipps Electric Llp | $25,000 | Stewart Title Sterling Inc |
Source: Public Records
Mortgage History
| Date | Status | Borrower | Loan Amount |
|---|---|---|---|
| Open | Jps Llc | $57,750 | |
| Previous Owner | Phipps Electric Llp | $20,000 |
Source: Public Records
Tax History Compared to Growth
Tax History
| Year | Tax Paid | Tax Assessment Tax Assessment Total Assessment is a certain percentage of the fair market value that is determined by local assessors to be the total taxable value of land and additions on the property. | Land | Improvement |
|---|---|---|---|---|
| 2024 | $1,316 | $25,630 | $0 | $0 |
| 2023 | $1,316 | $25,630 | $0 | $0 |
| 2022 | $1,982 | $23,530 | $5,800 | $17,730 |
| 2021 | $1,884 | $23,530 | $5,800 | $17,730 |
| 2020 | $1,260 | $29,940 | $4,290 | $25,650 |
| 2019 | $1,266 | $29,940 | $4,290 | $25,650 |
| 2018 | $1,159 | $13,690 | $3,830 | $9,860 |
| 2017 | $1,141 | $16,520 | $4,620 | $11,900 |
| 2015 | $1,032 | $15,820 | $3,920 | $11,900 |
| 2014 | $1,032 | $14,360 | $3,920 | $10,440 |
| 2013 | $1,032 | $14,360 | $3,920 | $10,440 |
Source: Public Records
Map
Nearby Homes