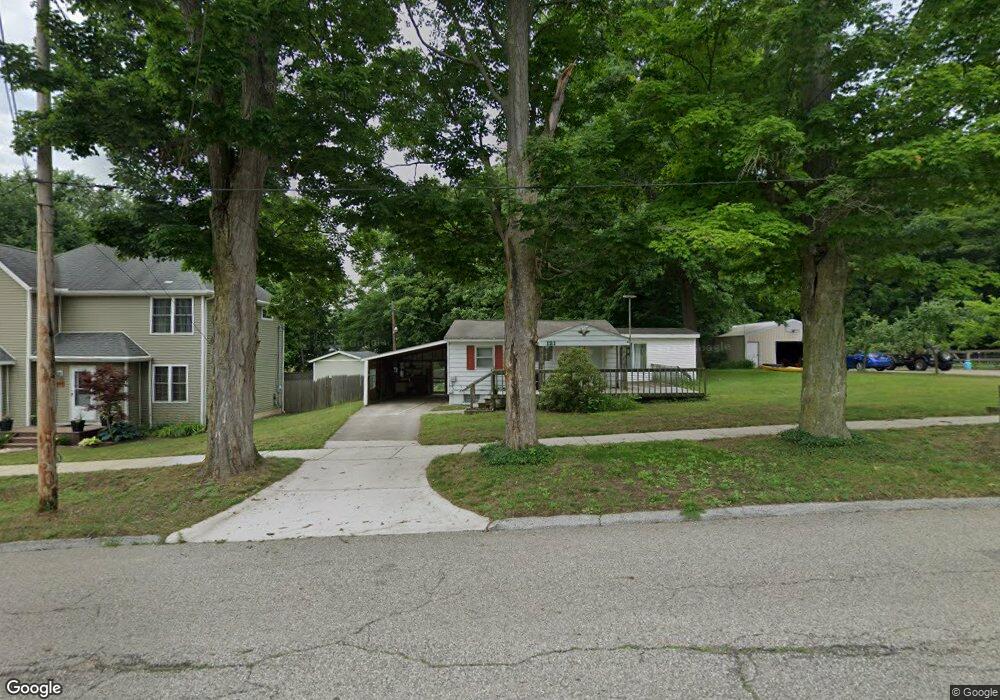
121 Knapp St Allegan, MI 49010
Estimated Value: $142,000 - $178,000
1
Bed
1
Bath
1,035
Sq Ft
$154/Sq Ft
Est. Value
About This Home
This home is located at 121 Knapp St, Allegan, MI 49010 and is currently estimated at $159,048, approximately $153 per square foot. 121 Knapp St is a home located in Allegan County with nearby schools including West Ward Elementary School, L.E. White Middle School, and Allegan High School.
Ownership History
Date
Name
Owned For
Owner Type
Purchase Details
Closed on
Jul 22, 2025
Sold by
Anderson Christopher E
Bought by
Anderson Family Trust
Current Estimated Value
Purchase Details
Closed on
Apr 16, 2013
Sold by
Michigan State Housing Development Autho
Bought by
Anderson Christopher E
Purchase Details
Closed on
Jan 5, 2012
Sold by
Stratton Gary D
Bought by
Michigan State Housing Development Autho
Purchase Details
Closed on
Dec 19, 2006
Sold by
Thompson Lucille M and Thompson Paul A
Bought by
Stratton Gary D
Home Financials for this Owner
Home Financials are based on the most recent Mortgage that was taken out on this home.
Original Mortgage
$51,020
Interest Rate
6.24%
Mortgage Type
Purchase Money Mortgage
Create a Home Valuation Report for This Property
The Home Valuation Report is an in-depth analysis detailing your home's value as well as a comparison with similar homes in the area
Home Values in the Area
Average Home Value in this Area
Purchase History
| Date | Buyer | Sale Price | Title Company |
|---|---|---|---|
| Anderson Family Trust | -- | None Listed On Document | |
| Anderson Family Trust | -- | None Listed On Document | |
| Anderson Christopher E | -- | Rels Title | |
| Michigan State Housing Development Autho | $15,300 | None Available | |
| Stratton Gary D | $50,000 | Chicago Title |
Source: Public Records
Mortgage History
| Date | Status | Borrower | Loan Amount |
|---|---|---|---|
| Previous Owner | Stratton Gary D | $51,020 |
Source: Public Records
Tax History Compared to Growth
Tax History
| Year | Tax Paid | Tax Assessment Tax Assessment Total Assessment is a certain percentage of the fair market value that is determined by local assessors to be the total taxable value of land and additions on the property. | Land | Improvement |
|---|---|---|---|---|
| 2025 | $1,499 | $53,200 | $21,700 | $31,500 |
| 2024 | $1,363 | $51,500 | $20,800 | $30,700 |
| 2023 | $1,408 | $45,300 | $19,500 | $25,800 |
| 2022 | $1,363 | $38,300 | $16,500 | $21,800 |
| 2021 | $1,308 | $34,200 | $13,000 | $21,200 |
| 2020 | $1,289 | $35,200 | $10,800 | $24,400 |
| 2019 | $1,260 | $31,300 | $9,800 | $21,500 |
| 2018 | $1,210 | $26,400 | $9,500 | $16,900 |
| 2017 | $0 | $23,900 | $8,000 | $15,900 |
| 2016 | $0 | $19,900 | $6,700 | $13,200 |
| 2015 | -- | $19,900 | $6,700 | $13,200 |
| 2014 | -- | $18,800 | $5,000 | $13,800 |
| 2013 | $1,282 | $21,500 | $5,000 | $16,500 |
Source: Public Records
Map
Nearby Homes