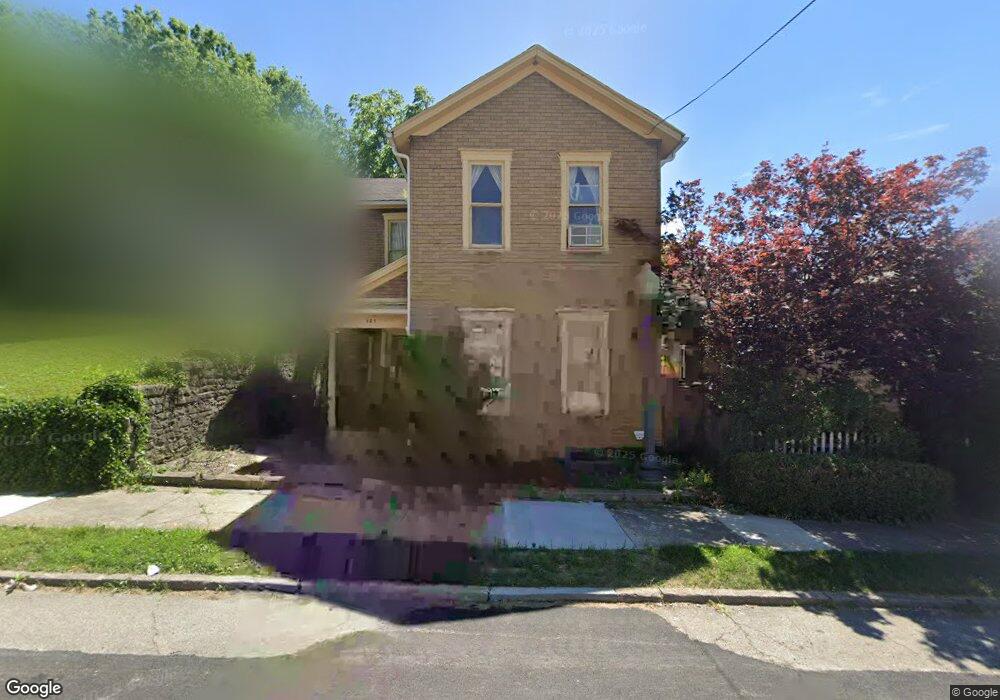
121 Morton Ave Dayton, OH 45410
South Park NeighborhoodEstimated Value: $99,772 - $226,000
3
Beds
2
Baths
1,400
Sq Ft
$107/Sq Ft
Est. Value
About This Home
This home is located at 121 Morton Ave, Dayton, OH 45410 and is currently estimated at $149,943, approximately $107 per square foot. 121 Morton Ave is a home located in Montgomery County with nearby schools including Ruskin Elementary School, Kiser Elementary, and Emerson Academy.
Ownership History
Date
Name
Owned For
Owner Type
Purchase Details
Closed on
Dec 23, 2024
Sold by
Tlo No 1 Llc
Bought by
Tlo No 2 Llc
Current Estimated Value
Purchase Details
Closed on
Jan 20, 2017
Sold by
T L O Family Limited
Bought by
Tlo No1 Llc
Purchase Details
Closed on
Aug 25, 1995
Sold by
Ostendorf Thomas L and Ostendorf Rita Marie
Bought by
Tlo Family Ltd Partnership No 1
Purchase Details
Closed on
May 3, 1994
Sold by
Ostendorf Thomas L
Bought by
Ostendorf Thomas L and Ostendorf Rita Marie
Create a Home Valuation Report for This Property
The Home Valuation Report is an in-depth analysis detailing your home's value as well as a comparison with similar homes in the area
Home Values in the Area
Average Home Value in this Area
Purchase History
| Date | Buyer | Sale Price | Title Company |
|---|---|---|---|
| Tlo No 2 Llc | -- | None Listed On Document | |
| Tlo No1 Llc | -- | -- | |
| Tlo Family Ltd Partnership No 1 | -- | -- | |
| Ostendorf Thomas L | -- | -- |
Source: Public Records
Tax History Compared to Growth
Tax History
| Year | Tax Paid | Tax Assessment Tax Assessment Total Assessment is a certain percentage of the fair market value that is determined by local assessors to be the total taxable value of land and additions on the property. | Land | Improvement |
|---|---|---|---|---|
| 2024 | $824 | $13,350 | $5,880 | $7,470 |
| 2023 | $824 | $13,350 | $5,880 | $7,470 |
| 2022 | $1,201 | $15,430 | $4,350 | $11,080 |
| 2021 | $1,194 | $15,430 | $4,350 | $11,080 |
| 2020 | $1,637 | $21,800 | $4,350 | $17,450 |
| 2019 | $631 | $7,270 | $4,350 | $2,920 |
| 2018 | $654 | $7,270 | $4,350 | $2,920 |
| 2017 | $649 | $7,270 | $4,350 | $2,920 |
| 2016 | $704 | $7,570 | $4,350 | $3,220 |
| 2015 | $669 | $7,570 | $4,350 | $3,220 |
| 2014 | $669 | $19,700 | $4,350 | $15,350 |
| 2012 | -- | $6,850 | $4,330 | $2,520 |
Source: Public Records
Map
Nearby Homes