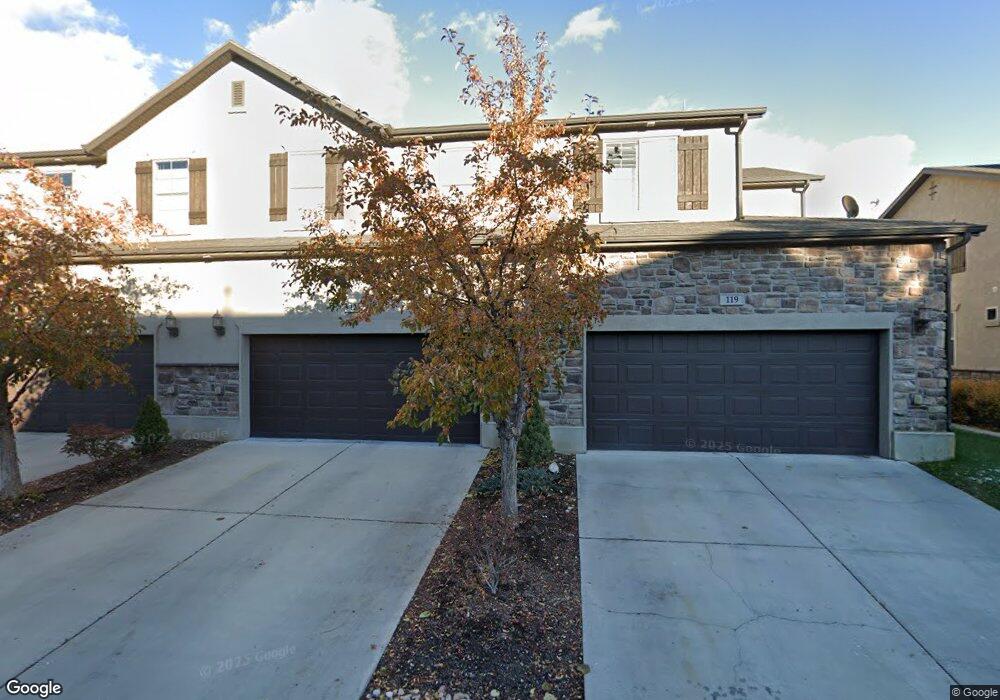
121 N 360 W Centerville, UT 84014
Estimated Value: $488,000 - $521,000
4
Beds
4
Baths
2,258
Sq Ft
$223/Sq Ft
Est. Value
About This Home
This home is located at 121 N 360 W, Centerville, UT 84014 and is currently estimated at $503,830, approximately $223 per square foot. 121 N 360 W is a home located in Davis County with nearby schools including J A Taylor Elementary School, Centerville Jr High, and Viewmont High School.
Ownership History
Date
Name
Owned For
Owner Type
Purchase Details
Closed on
Feb 7, 2019
Sold by
Vinson Torence Michael
Bought by
Dodson David and Dodson Dawn
Current Estimated Value
Home Financials for this Owner
Home Financials are based on the most recent Mortgage that was taken out on this home.
Original Mortgage
$120,000
Outstanding Balance
$105,289
Interest Rate
4.5%
Mortgage Type
New Conventional
Estimated Equity
$398,541
Purchase Details
Closed on
May 20, 2011
Sold by
Ferrell Todd
Bought by
Vinson Terence Michael
Purchase Details
Closed on
Jul 25, 2008
Sold by
Ivory Homes Ltd
Bought by
Ferrell Todd
Home Financials for this Owner
Home Financials are based on the most recent Mortgage that was taken out on this home.
Original Mortgage
$247,291
Interest Rate
5.75%
Mortgage Type
Purchase Money Mortgage
Purchase Details
Closed on
Nov 30, 2007
Sold by
Ivory Development Llc
Bought by
South Davis Sewer District
Create a Home Valuation Report for This Property
The Home Valuation Report is an in-depth analysis detailing your home's value as well as a comparison with similar homes in the area
Purchase History
| Date | Buyer | Sale Price | Title Company |
|---|---|---|---|
| Dodson David | -- | Highland Title Age Inc | |
| Vinson Terence Michael | -- | Lincoln Title Insura | |
| Ferrell Todd | -- | Cottonwood Title Ins Agency | |
| Ivory Homes Ltd | -- | Cottonwood Title Ins Agency | |
| South Davis Sewer District | -- | None Available |
Source: Public Records
Mortgage History
| Date | Status | Borrower | Loan Amount |
|---|---|---|---|
| Open | Dodson David | $120,000 | |
| Previous Owner | Ferrell Todd | $247,291 |
Source: Public Records
Tax History
| Year | Tax Paid | Tax Assessment Tax Assessment Total Assessment is a certain percentage of the fair market value that is determined by local assessors to be the total taxable value of land and additions on the property. | Land | Improvement |
|---|---|---|---|---|
| 2025 | $2,697 | $257,950 | $72,050 | $185,900 |
| 2024 | $2,663 | $259,050 | $55,000 | $204,050 |
| 2023 | $2,731 | $480,000 | $98,000 | $382,000 |
| 2022 | $2,841 | $275,000 | $52,800 | $222,200 |
| 2021 | $2,487 | $375,000 | $69,000 | $306,000 |
| 2020 | $2,129 | $321,000 | $64,500 | $256,500 |
| 2019 | $2,010 | $296,000 | $62,000 | $234,000 |
| 2018 | $1,849 | $269,000 | $58,000 | $211,000 |
| 2016 | $1,649 | $133,320 | $29,150 | $104,170 |
| 2015 | $1,692 | $127,820 | $29,150 | $98,670 |
| 2014 | $1,728 | $134,852 | $18,333 | $116,519 |
| 2013 | -- | $124,024 | $18,333 | $105,691 |
Source: Public Records
Map
Nearby Homes
- 147 N 360 W Unit 21
- 2 S 285 W
- 88 W 50 S Unit C-3
- 88 W 50 S Unit B5
- 56 W 200 N
- 330 W Paradiso Ln
- 324 S 600 W
- 493 W 620 N Unit 122
- 507 W 620 N
- 282 W 605 N Unit A
- 282 W 605 N Unit I
- 462 Pitford Dr
- 281 W 650 N Unit B
- 303 W 650 N Unit I
- 16 S 200 E
- 292 W 680 N
- 781 Pheasantbrook Dr
- 563 N 220 E
- 360 E Center St
- 775 Pheasantbrook Cir
Your Personal Tour Guide
Ask me questions while you tour the home.