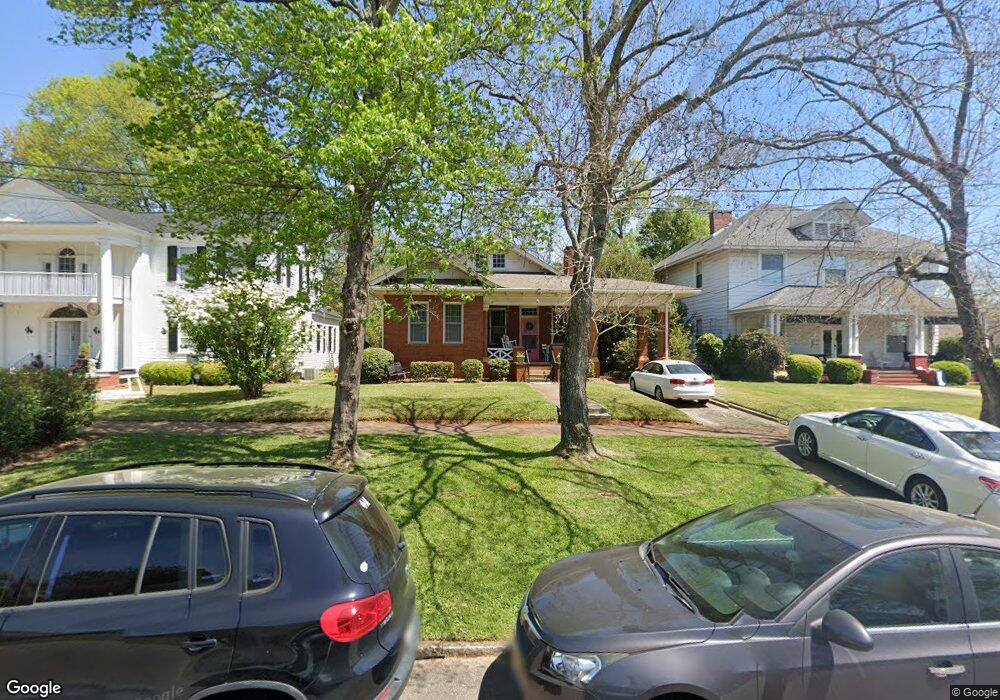
121 N Columbia St Milledgeville, GA 31061
Estimated Value: $238,000 - $306,000
3
Beds
2
Baths
1,710
Sq Ft
$161/Sq Ft
Est. Value
About This Home
This home is located at 121 N Columbia St, Milledgeville, GA 31061 and is currently estimated at $274,921, approximately $160 per square foot. 121 N Columbia St is a home located in Baldwin County with nearby schools including Lakeview Primary, Lakeview Academy, and Oak Hill Middle School.
Ownership History
Date
Name
Owned For
Owner Type
Purchase Details
Closed on
May 2, 2018
Sold by
Becker Hugh A
Bought by
Piedmont Investment Management
Current Estimated Value
Purchase Details
Closed on
Jun 15, 2013
Sold by
Hogan Ii Thomas Stanton
Bought by
Becker Hugh A and Becker Robin L
Purchase Details
Closed on
May 15, 2013
Sold by
Hogan Thomas Stanton
Bought by
Becker Hugh A and Becker Robin I
Purchase Details
Closed on
May 7, 2013
Sold by
Cooney Amella
Bought by
Becker Hugh A and Becker Robin L
Purchase Details
Closed on
May 6, 2013
Sold by
King Jacqueline Kidd Hogan
Bought by
Becker Hugh A and Becker Robin L
Purchase Details
Closed on
Apr 18, 2011
Sold by
Kidd Mary Evelyn Mcmanus
Bought by
Hogan Thomas Stanton and Cooney Amelia
Purchase Details
Closed on
Dec 1, 1997
Sold by
Kidd James M
Bought by
Kidd Evelyn
Purchase Details
Closed on
Dec 1, 1954
Bought by
Kidd James M
Create a Home Valuation Report for This Property
The Home Valuation Report is an in-depth analysis detailing your home's value as well as a comparison with similar homes in the area
Home Values in the Area
Average Home Value in this Area
Purchase History
| Date | Buyer | Sale Price | Title Company |
|---|---|---|---|
| Piedmont Investment Management | -- | -- | |
| Becker Hugh A | $57,300 | -- | |
| Becker Hugh A | $57,333 | -- | |
| Becker Hugh A | $57,333 | -- | |
| Becker Hugh A | $57,333 | -- | |
| Hogan Thomas Stanton | -- | -- | |
| Kidd Evelyn | -- | -- | |
| Kidd James M | -- | -- |
Source: Public Records
Tax History Compared to Growth
Tax History
| Year | Tax Paid | Tax Assessment Tax Assessment Total Assessment is a certain percentage of the fair market value that is determined by local assessors to be the total taxable value of land and additions on the property. | Land | Improvement |
|---|---|---|---|---|
| 2025 | $3,858 | $108,272 | $29,812 | $78,460 |
| 2024 | $3,858 | $108,272 | $29,812 | $78,460 |
| 2023 | $2,074 | $83,300 | $24,844 | $58,456 |
| 2022 | $2,088 | $84,636 | $24,844 | $59,792 |
| 2021 | $1,646 | $62,840 | $24,800 | $38,040 |
| 2020 | $1,623 | $62,840 | $24,800 | $38,040 |
| 2019 | $1,626 | $62,840 | $24,800 | $38,040 |
| 2018 | $1,635 | $62,840 | $24,800 | $38,040 |
| 2017 | $1,602 | $62,840 | $24,800 | $38,040 |
| 2016 | $1,465 | $54,440 | $12,680 | $41,760 |
| 2015 | $1,872 | $54,960 | $13,200 | $41,760 |
| 2014 | $1,484 | $54,960 | $13,200 | $41,760 |
Source: Public Records
Map
Nearby Homes
- Lot 2 Serenity Point
- 341 S Clark St
- 341 S Clarke St
- 751 W Montgomery St
- 151 W Washington St
- 500 N Tattnall St
- 2756 N North Columiba
- Lot 3 Serenity Point
- Lot 4 Serenity Point
- 111 S Elbert St
- 161 N Glynn St
- 601 N Wayne St
- 757 N Columbia St
- 120 E Screven St
- 641 N Cobb St
- 1101 W Hancock St
- 810 N Jackson St
- 321 Glenhaven Dr
- 111 N Columbia St
- 131 N Columbia St
- 431 W Hancock St
- 141 N Columbia St
- 441 W Hancock St
- 421 W Hancock St
- 120 N Clark St
- 151 N Columbia St
- 411 W Hancock St
- 130 N Clark St
- 420 W Mcintosh St
- 110 N Columbia St
- 100 N Columbia St
- 120 N Columbia St
- 100 N Clarke St
- 100 N Clark St
- 140 N Columbia St
- 150 N Clark St
- 434 W Hancock St
- 517 W Hancock St