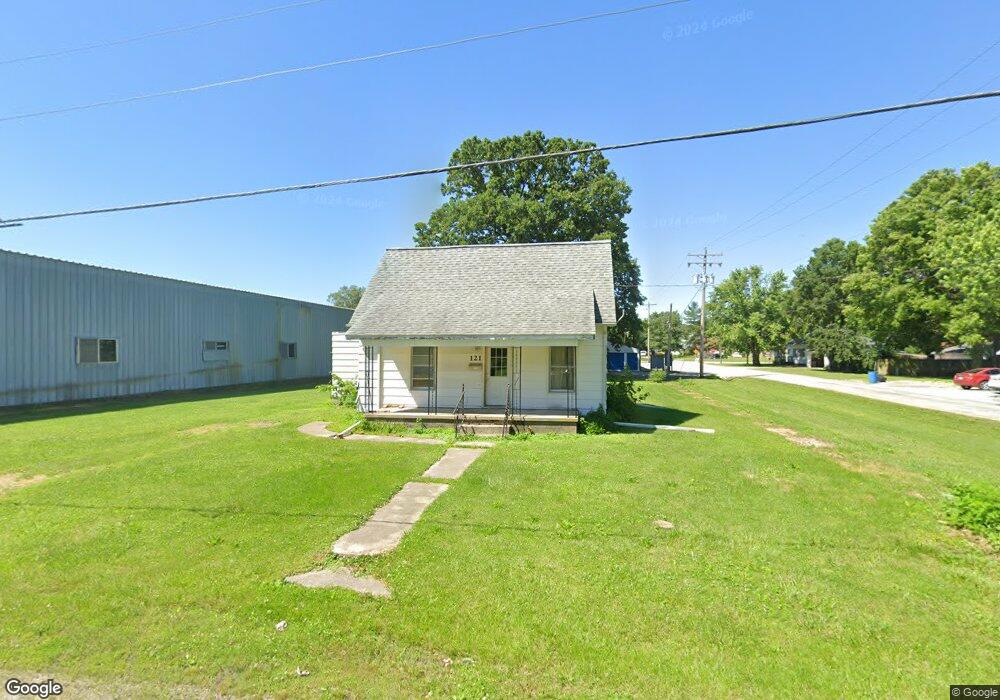
121 N Vine St Nokomis, IL 62075
Estimated Value: $42,000 - $68,000
--
Bed
--
Bath
1,008
Sq Ft
$51/Sq Ft
Est. Value
About This Home
This home is located at 121 N Vine St, Nokomis, IL 62075 and is currently estimated at $51,888, approximately $51 per square foot. 121 N Vine St is a home located in Montgomery County with nearby schools including North Elementary School, Nokomis Junior/Senior High School, and St. Louis Catholic School.
Ownership History
Date
Name
Owned For
Owner Type
Purchase Details
Closed on
Apr 19, 2019
Sold by
Blazich Philip
Bought by
Carroll Charlotte A
Current Estimated Value
Purchase Details
Closed on
Sep 20, 2008
Sold by
Sneddon James Ray and Burg Patricia Jean
Bought by
Blazich Philip N and Balzich Charlotte A
Home Financials for this Owner
Home Financials are based on the most recent Mortgage that was taken out on this home.
Original Mortgage
$15,000
Interest Rate
6.25%
Mortgage Type
Purchase Money Mortgage
Create a Home Valuation Report for This Property
The Home Valuation Report is an in-depth analysis detailing your home's value as well as a comparison with similar homes in the area
Home Values in the Area
Average Home Value in this Area
Purchase History
| Date | Buyer | Sale Price | Title Company |
|---|---|---|---|
| Carroll Charlotte A | -- | None Available | |
| Blazich Philip N | $10,500 | None Available |
Source: Public Records
Mortgage History
| Date | Status | Borrower | Loan Amount |
|---|---|---|---|
| Previous Owner | Blazich Philip N | $15,000 |
Source: Public Records
Tax History Compared to Growth
Tax History
| Year | Tax Paid | Tax Assessment Tax Assessment Total Assessment is a certain percentage of the fair market value that is determined by local assessors to be the total taxable value of land and additions on the property. | Land | Improvement |
|---|---|---|---|---|
| 2024 | $693 | $7,970 | $2,200 | $5,770 |
| 2023 | $656 | $7,470 | $2,060 | $5,410 |
| 2022 | $644 | $7,180 | $1,980 | $5,200 |
| 2021 | $664 | $7,510 | $2,070 | $5,440 |
| 2020 | $637 | $7,150 | $1,970 | $5,180 |
| 2019 | $231 | $7,550 | $2,080 | $5,470 |
| 2018 | $238 | $7,110 | $1,960 | $5,150 |
| 2017 | $251 | $6,680 | $1,840 | $4,840 |
| 2016 | $255 | $6,500 | $1,790 | $4,710 |
| 2015 | $246 | $6,290 | $1,730 | $4,560 |
| 2013 | $246 | $6,360 | $1,750 | $4,610 |
Source: Public Records
Map
Nearby Homes