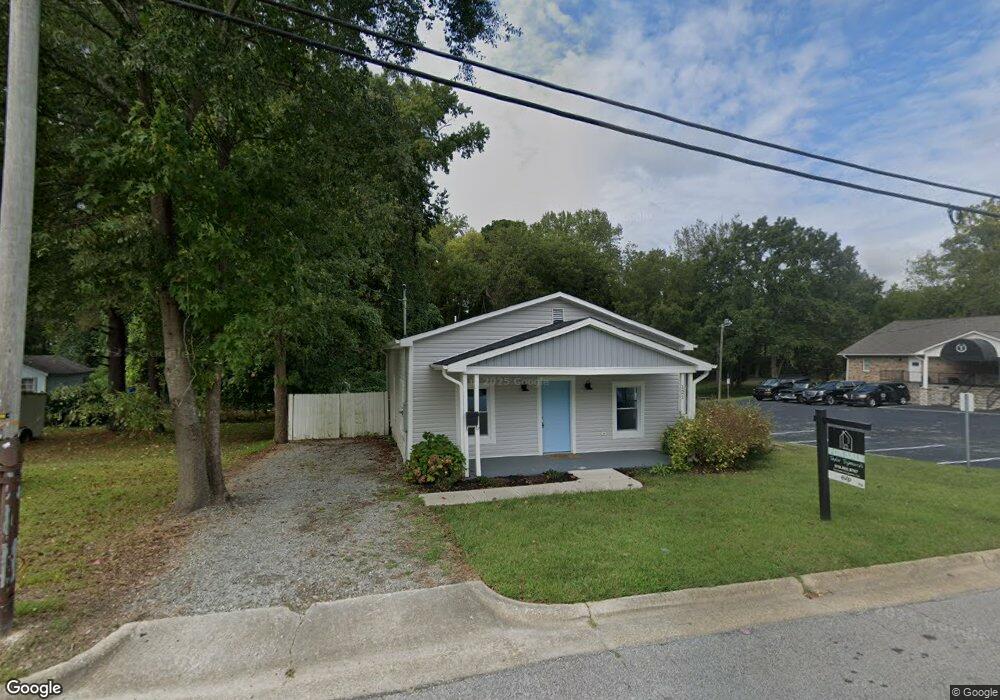
121 N W Fuquay Varina, NC 27526
Estimated Value: $250,000 - $273,000
2
Beds
1
Bath
780
Sq Ft
$336/Sq Ft
Est. Value
About This Home
This home is located at 121 N W, Fuquay Varina, NC 27526 and is currently estimated at $261,889, approximately $335 per square foot. 121 N W is a home located in Wake County with nearby schools including Buckhorn Creek Elementary, Fuquay-Varina High, and Achievement Charter Academy.
Ownership History
Date
Name
Owned For
Owner Type
Purchase Details
Closed on
Feb 10, 2022
Sold by
John Edward Rodriguez Family Revocable L
Bought by
Cannada Cassidy L and Scarzfava Kyle E
Current Estimated Value
Home Financials for this Owner
Home Financials are based on the most recent Mortgage that was taken out on this home.
Original Mortgage
$234,900
Outstanding Balance
$218,644
Interest Rate
3.75%
Mortgage Type
New Conventional
Estimated Equity
$43,245
Purchase Details
Closed on
Feb 15, 2021
Sold by
Cabral Costa Sandra and Costa Jorge
Bought by
John Edward Rodriguez Family Rlt
Purchase Details
Closed on
Aug 27, 2020
Sold by
Casta Jorge
Bought by
Offer Hut Llc
Purchase Details
Closed on
Dec 13, 2005
Sold by
Spence Joseph and Spence Lillian
Bought by
Costa Jorge and Cabral Costa Sandra
Purchase Details
Closed on
Aug 13, 2002
Sold by
Smart Gertrude Spence
Bought by
Spence Joseph
Create a Home Valuation Report for This Property
The Home Valuation Report is an in-depth analysis detailing your home's value as well as a comparison with similar homes in the area
Home Values in the Area
Average Home Value in this Area
Purchase History
| Date | Buyer | Sale Price | Title Company |
|---|---|---|---|
| Cannada Cassidy L | $233,000 | None Listed On Document | |
| John Edward Rodriguez Family Rlt | $78,000 | None Available | |
| Offer Hut Llc | -- | None Listed On Document | |
| Costa Jorge | $40,000 | None Available | |
| Spence Joseph | $2,500 | -- |
Source: Public Records
Mortgage History
| Date | Status | Borrower | Loan Amount |
|---|---|---|---|
| Open | Cannada Cassidy L | $234,900 |
Source: Public Records
Tax History Compared to Growth
Tax History
| Year | Tax Paid | Tax Assessment Tax Assessment Total Assessment is a certain percentage of the fair market value that is determined by local assessors to be the total taxable value of land and additions on the property. | Land | Improvement |
|---|---|---|---|---|
| 2025 | $1,935 | $218,829 | $75,000 | $143,829 |
| 2024 | $1,927 | $218,829 | $75,000 | $143,829 |
| 2023 | $1,329 | $117,691 | $18,000 | $99,691 |
| 2022 | $681 | $117,691 | $18,000 | $99,691 |
| 2021 | $650 | $63,270 | $18,000 | $45,270 |
| 2020 | $650 | $63,270 | $18,000 | $45,270 |
| 2019 | $485 | $40,327 | $12,000 | $28,327 |
| 2018 | $458 | $40,327 | $12,000 | $28,327 |
| 2017 | $442 | $40,327 | $12,000 | $28,327 |
| 2016 | $437 | $40,327 | $12,000 | $28,327 |
| 2015 | $453 | $43,304 | $8,400 | $34,904 |
| 2014 | $437 | $43,304 | $8,400 | $34,904 |
Source: Public Records
Map
Nearby Homes
- 121 N West St
- 130 Rusling Leaf Dr
- 146 Rusling Leaf Dr
- 104 Lawrence St
- 306 Country Side Way
- 318 Country Side Way
- 77 Saintsbury Dr
- 63 Saintsbury Dr
- 2200 Astride Way
- 105 Bridge St
- Pamlico Plan at Midtown Rows
- Yadkin Plan at Midtown Rows
- 114 Tweedbank Ct
- 150 Rusling Leaf Dr
- 711 Dogwood St
- 414 Longfellow St
- 716 Parker St
- 425 Longfellow St
- 464 Longfellow St
- 431 Longfellow St