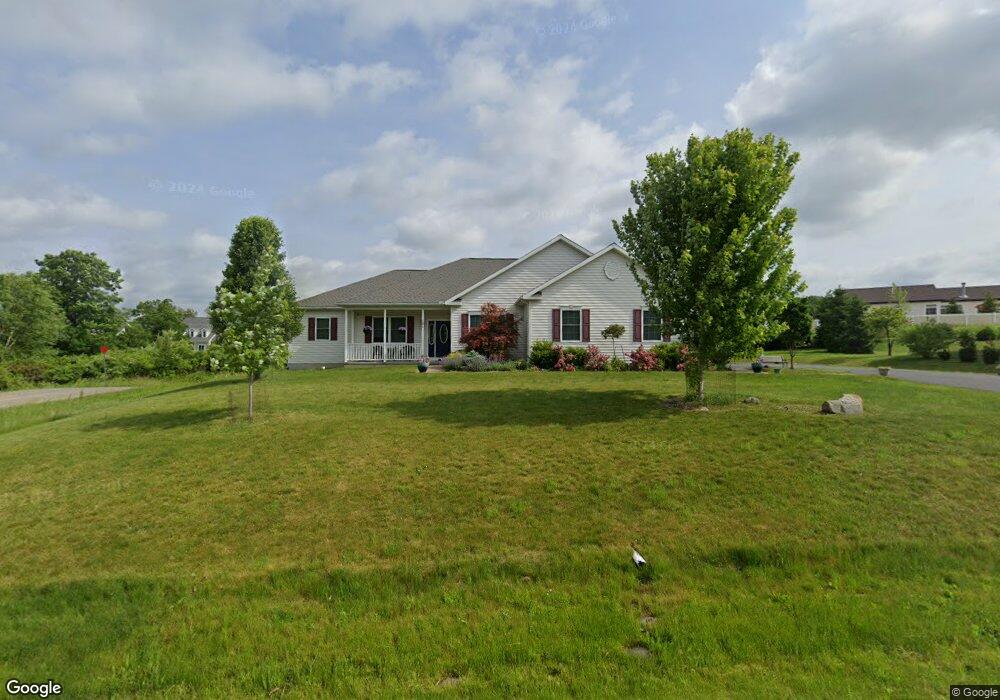
121 Nor Way Ithaca, NY 14850
Estimated Value: $490,000 - $647,578
3
Beds
3
Baths
2,355
Sq Ft
$256/Sq Ft
Est. Value
About This Home
This home is located at 121 Nor Way, Ithaca, NY 14850 and is currently estimated at $602,645, approximately $255 per square foot. 121 Nor Way is a home with nearby schools including Beverly J. Martin Elementary School, DeWitt Middle School, and Ithaca Senior High School.
Ownership History
Date
Name
Owned For
Owner Type
Purchase Details
Closed on
Sep 20, 2019
Sold by
Baker Michael and Boosembark-Baker Nicole
Bought by
Boosembark-Baker Nicole
Current Estimated Value
Home Financials for this Owner
Home Financials are based on the most recent Mortgage that was taken out on this home.
Original Mortgage
$200,000
Outstanding Balance
$172,082
Interest Rate
3.5%
Mortgage Type
New Conventional
Estimated Equity
$430,563
Purchase Details
Closed on
Oct 27, 2014
Sold by
The Heights Of Lansing Development Llc
Bought by
Baker Michael and Boosembark-Baker
Create a Home Valuation Report for This Property
The Home Valuation Report is an in-depth analysis detailing your home's value as well as a comparison with similar homes in the area
Home Values in the Area
Average Home Value in this Area
Purchase History
We collect this data history from publicly available records. To have your information removed, we recommend requesting removal directly through your county’s website.
| Date | Buyer | Sale Price | Title Company |
|---|---|---|---|
| Boosembark-Baker Nicole | $62,000 | -- | |
| Baker Michael | $90,000 | Adam Klausner |
Source: Public Records
Mortgage History
We collect this data history from publicly available records. To have your information removed, we recommend requesting removal directly through your county’s website.
| Date | Status | Borrower | Loan Amount |
|---|---|---|---|
| Open | Boosembark-Baker Nicole | $200,000 |
Source: Public Records
Tax History
| Year | Tax Paid | Tax Assessment Tax Assessment Total Assessment is a certain percentage of the fair market value that is determined by local assessors to be the total taxable value of land and additions on the property. | Land | Improvement |
|---|---|---|---|---|
| 2025 | $13,708 | $575,000 | $116,700 | $458,300 |
| 2024 | $13,708 | $575,000 | $116,700 | $458,300 |
| 2023 | $12,498 | $483,000 | $116,700 | $366,300 |
| 2022 | $12,219 | $460,000 | $116,700 | $343,300 |
| 2021 | $11,882 | $440,000 | $116,700 | $323,300 |
| 2020 | $11,882 | $440,000 | $116,700 | $323,300 |
| 2019 | $3,923 | $440,000 | $116,700 | $323,300 |
| 2018 | $10,993 | $400,000 | $116,700 | $283,300 |
| 2017 | $11,186 | $400,000 | $69,100 | $330,900 |
| 2016 | $10,858 | $400,000 | $69,100 | $330,900 |
| 2015 | -- | $100,000 | $59,300 | $40,700 |
| 2014 | -- | $7,900 | $7,900 | $0 |
Source: Public Records
Map
Nearby Homes
Your Personal Tour Guide
Ask me questions while you tour the home.