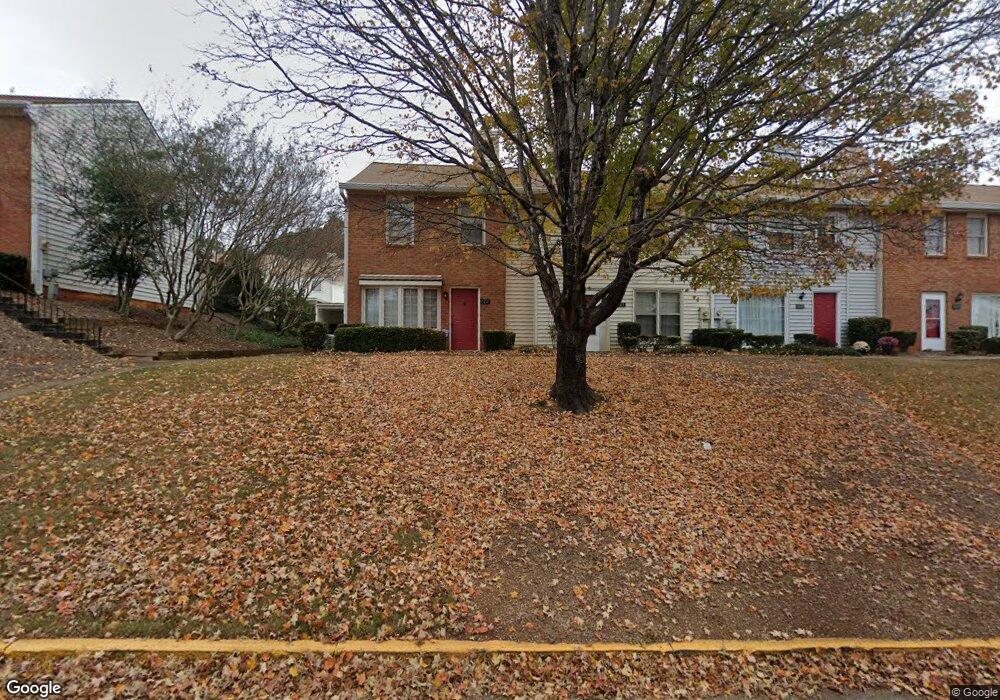
121 Old Ferry Way Unit 2 Roswell, GA 30076
Estimated Value: $254,183 - $266,000
2
Beds
3
Baths
1,240
Sq Ft
$209/Sq Ft
Est. Value
About This Home
This home is located at 121 Old Ferry Way Unit 2, Roswell, GA 30076 and is currently estimated at $259,546, approximately $209 per square foot. 121 Old Ferry Way Unit 2 is a home located in Fulton County with nearby schools including Mimosa Elementary School, Haynes Bridge Middle School, and Centennial High School.
Ownership History
Date
Name
Owned For
Owner Type
Purchase Details
Closed on
Mar 5, 2002
Sold by
Ryland Frank
Bought by
Esbrook Mark J
Current Estimated Value
Home Financials for this Owner
Home Financials are based on the most recent Mortgage that was taken out on this home.
Original Mortgage
$92,547
Outstanding Balance
$38,115
Interest Rate
6.86%
Mortgage Type
FHA
Estimated Equity
$221,431
Purchase Details
Closed on
Sep 9, 1999
Sold by
Bouchenni Afif
Bought by
Dowd Michael S
Home Financials for this Owner
Home Financials are based on the most recent Mortgage that was taken out on this home.
Original Mortgage
$60,300
Interest Rate
7.91%
Mortgage Type
New Conventional
Purchase Details
Closed on
Mar 31, 1994
Sold by
Vizurraga Luis A
Bought by
Bouhenni Afif
Home Financials for this Owner
Home Financials are based on the most recent Mortgage that was taken out on this home.
Original Mortgage
$40,800
Interest Rate
7.1%
Create a Home Valuation Report for This Property
The Home Valuation Report is an in-depth analysis detailing your home's value as well as a comparison with similar homes in the area
Home Values in the Area
Average Home Value in this Area
Purchase History
| Date | Buyer | Sale Price | Title Company |
|---|---|---|---|
| Esbrook Mark J | $94,000 | -- | |
| Dowd Michael S | $67,000 | -- | |
| Bouhenni Afif | $51,000 | -- |
Source: Public Records
Mortgage History
| Date | Status | Borrower | Loan Amount |
|---|---|---|---|
| Open | Esbrook Mark J | $92,547 | |
| Previous Owner | Dowd Michael S | $60,300 | |
| Previous Owner | Bouhenni Afif | $40,800 |
Source: Public Records
Tax History Compared to Growth
Tax History
| Year | Tax Paid | Tax Assessment Tax Assessment Total Assessment is a certain percentage of the fair market value that is determined by local assessors to be the total taxable value of land and additions on the property. | Land | Improvement |
|---|---|---|---|---|
| 2025 | $231 | $76,320 | $17,440 | $58,880 |
| 2023 | $2,439 | $86,400 | $14,960 | $71,440 |
| 2022 | $709 | $73,720 | $14,880 | $58,840 |
| 2021 | $851 | $57,920 | $8,280 | $49,640 |
| 2020 | $860 | $52,000 | $9,160 | $42,840 |
| 2019 | $159 | $41,800 | $5,120 | $36,680 |
| 2018 | $810 | $40,800 | $5,000 | $35,800 |
| 2017 | $537 | $30,360 | $3,920 | $26,440 |
| 2016 | $536 | $30,360 | $3,920 | $26,440 |
| 2015 | $703 | $30,360 | $3,920 | $26,440 |
| 2014 | $286 | $17,120 | $4,760 | $12,360 |
Source: Public Records
Map
Nearby Homes
- 222 Mill Creek Place
- 223 High Creek Dr Unit 3A
- 205 High Creek Dr
- 1016 Old Holcomb Bridge Rd
- 151 Old Ferry Way
- 238 Chads Ford Way
- 237 Chads Ford Way
- 988 Old Holcomb Bridge Rd
- 992 Old Holcomb Bridge Rd
- Washington Plan at Ivanhoe - Liberty Series
- 2046 Heathermere Way
- 425 Worthington Hills Ct
- 420 Old Holcomb Bridge Rd
- 1048 Merrivale Chase Ln
- 10630 Worthington Hills Manor
- 1210 Roswell Manor Cir
- 1063 Merrivale Chase Ln
- 146 Willow Stream Ct
- 155 Willow Stream Ct
- 119 Old Ferry Way
- 123 Old Ferry Way Unit 2
- 117 Old Ferry Way Unit 117
- 117 Old Ferry Way
- 117 Old Ferry Way Unit 2
- 115 Old Ferry Way
- 125 Old Ferry Way
- 113 Old Ferry Way
- 226 Mill Creek Place Unit 240
- 226 Mill Creek Place
- 226 Mill Creek Place Unit 226
- 127 Old Ferry Way Unit 127
- 127 Old Ferry Way
- 224 Mill Creek Place
- 228 Mill Creek Place
- 129 Old Ferry Way
- 220 Mill Creek Place Unit 2
- 230 Mill Creek Place
- 111 Old Ferry Way
- 218 Mill Creek Place