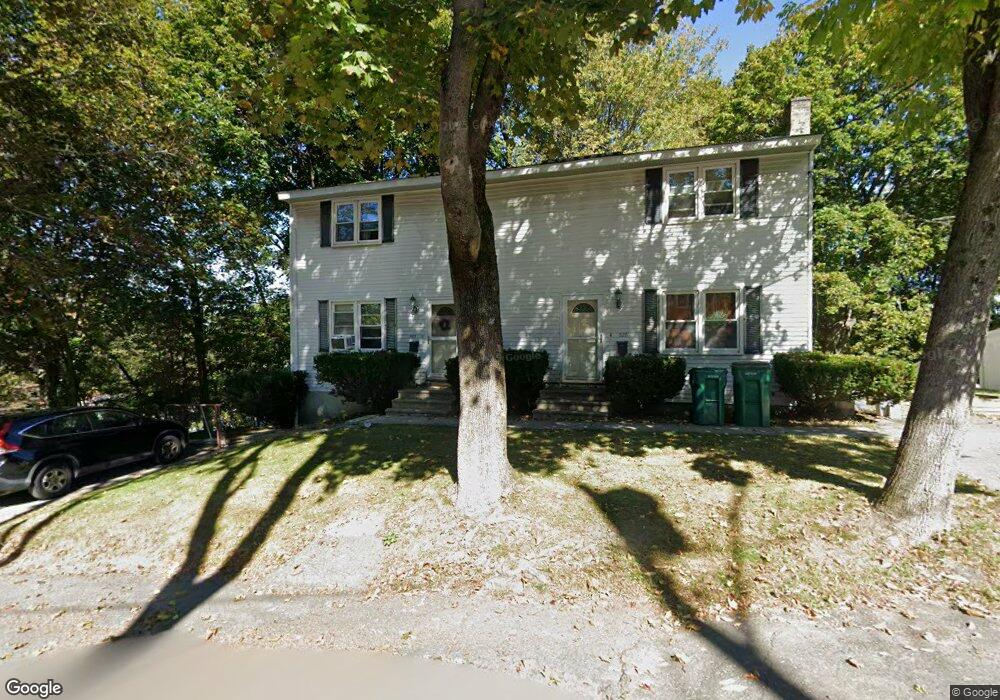
121 Pershing St Unit 123 Fitchburg, MA 01420
Cleghorn NeighborhoodEstimated Value: $289,000 - $472,000
4
Beds
4
Baths
2,100
Sq Ft
$196/Sq Ft
Est. Value
About This Home
This home is located at 121 Pershing St Unit 123, Fitchburg, MA 01420 and is currently estimated at $410,995, approximately $195 per square foot. 121 Pershing St Unit 123 is a home located in Worcester County with nearby schools including Reingold Elementary School, South Street Elementary School, and Crocker Elementary School.
Ownership History
Date
Name
Owned For
Owner Type
Purchase Details
Closed on
Sep 12, 2002
Sold by
Marshall Steven E and Marshall Ann Marie
Bought by
Polcaro John D and Briggs Victoria L
Current Estimated Value
Home Financials for this Owner
Home Financials are based on the most recent Mortgage that was taken out on this home.
Original Mortgage
$170,621
Outstanding Balance
$72,521
Interest Rate
6.48%
Mortgage Type
Purchase Money Mortgage
Estimated Equity
$338,474
Purchase Details
Closed on
Sep 1, 1995
Sold by
Gallagher Robert G and Gallagher Deborah
Bought by
Marshall Steven E and Russell Ann Marie
Home Financials for this Owner
Home Financials are based on the most recent Mortgage that was taken out on this home.
Original Mortgage
$101,650
Interest Rate
7.61%
Mortgage Type
Purchase Money Mortgage
Create a Home Valuation Report for This Property
The Home Valuation Report is an in-depth analysis detailing your home's value as well as a comparison with similar homes in the area
Home Values in the Area
Average Home Value in this Area
Purchase History
| Date | Buyer | Sale Price | Title Company |
|---|---|---|---|
| Polcaro John D | $172,000 | -- | |
| Marshall Steven E | $107,000 | -- |
Source: Public Records
Mortgage History
| Date | Status | Borrower | Loan Amount |
|---|---|---|---|
| Open | Marshall Steven E | $170,621 | |
| Previous Owner | Marshall Steven E | $135,411 | |
| Previous Owner | Marshall Steven E | $101,650 |
Source: Public Records
Tax History Compared to Growth
Tax History
| Year | Tax Paid | Tax Assessment Tax Assessment Total Assessment is a certain percentage of the fair market value that is determined by local assessors to be the total taxable value of land and additions on the property. | Land | Improvement |
|---|---|---|---|---|
| 2025 | $53 | $393,100 | $103,100 | $290,000 |
| 2024 | $4,958 | $334,800 | $67,500 | $267,300 |
| 2023 | $4,800 | $299,600 | $59,000 | $240,600 |
| 2022 | $4,337 | $246,300 | $50,600 | $195,700 |
| 2021 | $4,354 | $228,800 | $41,000 | $187,800 |
| 2020 | $4,086 | $207,300 | $38,500 | $168,800 |
| 2019 | $3,869 | $188,800 | $50,600 | $138,200 |
| 2018 | $3,771 | $179,500 | $47,000 | $132,500 |
| 2017 | $3,404 | $158,400 | $47,000 | $111,400 |
| 2016 | $3,312 | $156,000 | $44,600 | $111,400 |
| 2015 | $3,348 | $161,900 | $43,400 | $118,500 |
| 2014 | $3,266 | $164,700 | $43,400 | $121,300 |
Source: Public Records
Map
Nearby Homes
- 36 England Ave
- 19 Ashburnham St
- 411 Daniels St
- 358-360 Fairmount St
- 51 Exeter St
- 45 Norwood St
- 14 Felton St
- 87 Eaton St
- 276 Fairmount St
- 592 Westminster Hill Rd
- 17 Simonds Rd
- 57 Highview St
- 555 Oak Hill Rd
- 9 Martel St
- 271 Beech St
- 36 Martel St
- 204 Roosevelt St
- 108-R Pratt St
- 0 River St
- 3 Rockland St
- 115 Pershing St Unit 117
- 135 Pershing St
- 12 Leroy St
- 120 Pershing St
- 206 Reingold Ave
- 114 Pershing St
- 128 Pershing St Unit 3
- 128 Pershing St Unit 2
- 128 Pershing St Unit 1
- 128 Pershing St
- 128 Pershing St Unit C
- 10 Leroy St
- 58 Leroy St
- 190 Reingold Ave
- 27 Leroy St
- 226 Reingold Ave
- 41 Leroy St
- 8 Leroy St
- 178 Newtonville Ave
- 508 Fairmount St