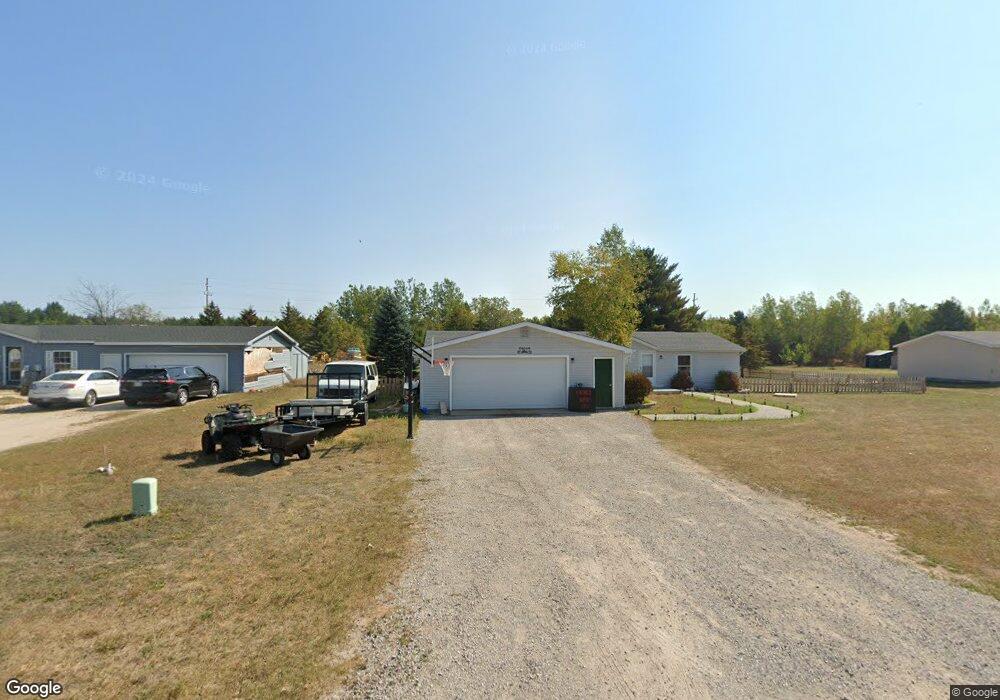
121 Poplar Rd Pellston, MI 49769
Estimated Value: $230,771 - $251,000
Studio
--
Bath
1,560
Sq Ft
$153/Sq Ft
Est. Value
About This Home
This home is located at 121 Poplar Rd, Pellston, MI 49769 and is currently estimated at $238,193, approximately $152 per square foot. 121 Poplar Rd is a home located in Emmet County with nearby schools including Pellston Elementary School and Pellston Middle/High School.
Ownership History
Date
Name
Owned For
Owner Type
Purchase Details
Closed on
Mar 3, 2026
Sold by
Krasiejko David
Bought by
Emmet County Treasurer
Current Estimated Value
Purchase Details
Closed on
Nov 19, 2021
Sold by
Lone Rock Investments Llc
Bought by
Krasiejko David
Purchase Details
Closed on
Jun 30, 2021
Sold by
Headley Samuel L
Bought by
Lone Rock Investments Llc
Purchase Details
Closed on
Feb 2, 2021
Sold by
Headley Samuel L
Bought by
Robert Hicks Investments Llc
Purchase Details
Closed on
Oct 11, 2007
Sold by
Mesner Jason and Mesner Brandi
Bought by
Headley Samuel L and Siler Kathryn L
Home Financials for this Owner
Home Financials are based on the most recent Mortgage that was taken out on this home.
Original Mortgage
$81,357
Interest Rate
6.33%
Purchase Details
Closed on
Jan 31, 2007
Bought by
Mesner Jason and Mesner Brandi
Purchase Details
Closed on
Feb 25, 2006
Bought by
Washington Mutual Bank
Purchase Details
Closed on
Nov 28, 2001
Sold by
Newton John J
Bought by
Yates Kimberly
Purchase Details
Closed on
Dec 1, 1990
Sold by
Whitcomb Wd L579 P331
Bought by
Newton Rps
Create a Home Valuation Report for This Property
The Home Valuation Report is an in-depth analysis detailing your home's value as well as a comparison with similar homes in the area
Purchase History
| Date | Buyer | Sale Price | Title Company |
|---|---|---|---|
| Emmet County Treasurer | $2,704 | -- | |
| Krasiejko David | $164,900 | -- | |
| Lone Rock Investments Llc | $77,788 | -- | |
| Robert Hicks Investments Llc | -- | -- | |
| Headley Samuel L | $82,000 | -- | |
| Mesner Jason | $61,900 | -- | |
| Washington Mutual Bank | $98,900 | -- | |
| Yates Kimberly | $99,900 | -- | |
| Newton Rps | $2,000 | -- |
Source: Public Records
Mortgage History
| Date | Status | Borrower | Loan Amount |
|---|---|---|---|
| Previous Owner | Headley Samuel L | $81,357 |
Source: Public Records
Tax History
| Year | Tax Paid | Tax Assessment Tax Assessment Total Assessment is a certain percentage of the fair market value that is determined by local assessors to be the total taxable value of land and additions on the property. | Land | Improvement |
|---|---|---|---|---|
| 2025 | $1,873 | $92,700 | $0 | $92,700 |
| 2024 | $13 | $76,400 | $0 | $76,400 |
| 2023 | $1,747 | $72,000 | $0 | $72,000 |
| 2022 | $1,747 | $55,200 | $0 | $55,200 |
| 2021 | $1,886 | $40,500 | $0 | $40,500 |
| 2020 | $1,883 | $41,000 | $0 | $41,000 |
| 2019 | -- | $40,500 | $500 | $40,000 |
| 2018 | -- | $34,200 | $500 | $33,700 |
| 2017 | -- | $34,600 | $500 | $34,100 |
| 2016 | -- | $34,800 | $500 | $34,300 |
| 2015 | -- | $34,500 | $0 | $0 |
| 2014 | -- | $34,500 | $0 | $0 |
Source: Public Records
Map
Nearby Homes
- 6457 State St
- 6421 Airport Crossing Rd Unit 1
- 8959 Robinson Rd
- TBD Teal Rd
- 8016 Silver Strand Rd
- 11115 Douglas Lake Rd
- 4333 U S 31
- 10999 Koepke Rd
- 10222 W Munro Lake Dr
- 5100 N Bay Way
- 6105 U S 31
- 1830 Indian Point Rd
- 6167 Lambert Dr
- 6737 Honeysette Rd
- 1442 Indian Point Rd
- 5441 Valley Rd
- 7084 Center St
- 7181 Maple St
- 7325 Keystone Park Dr Unit 18
- 393 Beaux Rivages Dr
Your Personal Tour Guide
Ask me questions while you tour the home.