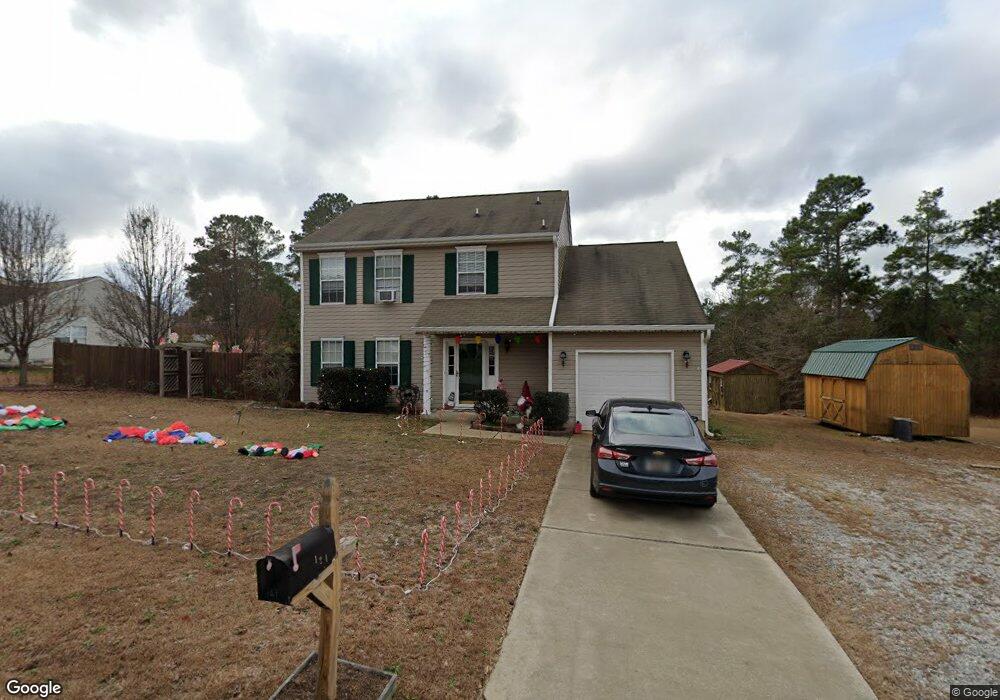
121 Quigley Ct Lexington, SC 29073
Estimated Value: $221,000 - $251,000
3
Beds
3
Baths
1,674
Sq Ft
$144/Sq Ft
Est. Value
About This Home
This home is located at 121 Quigley Ct, Lexington, SC 29073 and is currently estimated at $241,110, approximately $144 per square foot. 121 Quigley Ct is a home located in Lexington County with nearby schools including Deerfield Elementary School, Carolina Springs Middle School, and White Knoll High School.
Ownership History
Date
Name
Owned For
Owner Type
Purchase Details
Closed on
May 26, 2020
Sold by
Coler Laura M
Bought by
Brazel Laura Marie
Current Estimated Value
Home Financials for this Owner
Home Financials are based on the most recent Mortgage that was taken out on this home.
Original Mortgage
$107,000
Outstanding Balance
$95,024
Interest Rate
3.3%
Mortgage Type
New Conventional
Estimated Equity
$146,086
Purchase Details
Closed on
Apr 30, 2014
Sold by
Wilson Shannon T
Bought by
Coler Laura M
Purchase Details
Closed on
Sep 24, 2012
Sold by
Tyson Properties Llc
Bought by
Wilson Shannon T
Purchase Details
Closed on
Jul 1, 2005
Sold by
Wilson Shannon T
Bought by
Tyson Properties Llc
Purchase Details
Closed on
Mar 11, 2005
Sold by
Nvr Rymarc Homes Of South Carolina Llc
Bought by
Wilson Shannon T
Home Financials for this Owner
Home Financials are based on the most recent Mortgage that was taken out on this home.
Original Mortgage
$102,761
Interest Rate
6.72%
Mortgage Type
Adjustable Rate Mortgage/ARM
Create a Home Valuation Report for This Property
The Home Valuation Report is an in-depth analysis detailing your home's value as well as a comparison with similar homes in the area
Home Values in the Area
Average Home Value in this Area
Purchase History
| Date | Buyer | Sale Price | Title Company |
|---|---|---|---|
| Brazel Laura Marie | -- | First American Title | |
| Coler Laura M | $122,500 | -- | |
| Wilson Shannon T | -- | -- | |
| Tyson Properties Llc | -- | -- | |
| Wilson Shannon T | $108,170 | -- |
Source: Public Records
Mortgage History
| Date | Status | Borrower | Loan Amount |
|---|---|---|---|
| Open | Brazel Laura Marie | $107,000 | |
| Previous Owner | Wilson Shannon T | $102,761 |
Source: Public Records
Tax History Compared to Growth
Tax History
| Year | Tax Paid | Tax Assessment Tax Assessment Total Assessment is a certain percentage of the fair market value that is determined by local assessors to be the total taxable value of land and additions on the property. | Land | Improvement |
|---|---|---|---|---|
| 2024 | $792 | $5,295 | $1,000 | $4,295 |
| 2023 | $792 | $5,295 | $1,000 | $4,295 |
| 2020 | $810 | $5,295 | $1,000 | $4,295 |
| 2019 | $762 | $4,900 | $840 | $4,060 |
| 2018 | $748 | $4,900 | $840 | $4,060 |
| 2017 | $725 | $4,900 | $840 | $4,060 |
| 2016 | $719 | $4,900 | $840 | $4,060 |
| 2014 | $704 | $5,022 | $840 | $4,182 |
| 2013 | -- | $7,530 | $1,260 | $6,270 |
Source: Public Records
Map
Nearby Homes
- 105 Josie Ct
- 416 Knotts Ct
- 212 Siddington Way
- 311 Knotts Cir
- 963 Sequoia Dr
- 472 Ridgehill Dr
- 947 Sequoia Dr
- 167 Mesa Verde Dr
- 220 Socrates St
- 712 Vanguard St
- 6343 Platt Springs Rd
- 116 Bridleridge Rd
- 156 Loyd Ct
- 6104 Platt Springs Rd
- 129 Loyd Ct
- 1843 Lilac Way
- 244 Keegan Rock Ct
- 1839 Lilac Way
- 1835 Lilac Way
- 915 Cornwallis Way
- 125 Quigley Ct
- 117 Quigley Ct
- 126 Quigley Ct
- 130 Quigley Ct
- 122 Quigley Ct
- 129 Quigley Ct
- 134 Quigley Ct
- 118 Quigley Ct
- 113 Quigley Ct
- 133 Quigley Ct
- 114 Quigley Ct
- 138 Quigley Ct
- 109 Quigley Ct
- 137 Quigley Ct
- 110 Quigley Ct
- 404 Smokey Joe Ct
- 108 Quigley Ct
- 249 Ridgehill Dr
- 245 Ridgehill Dr
- 142 Quigley Ct