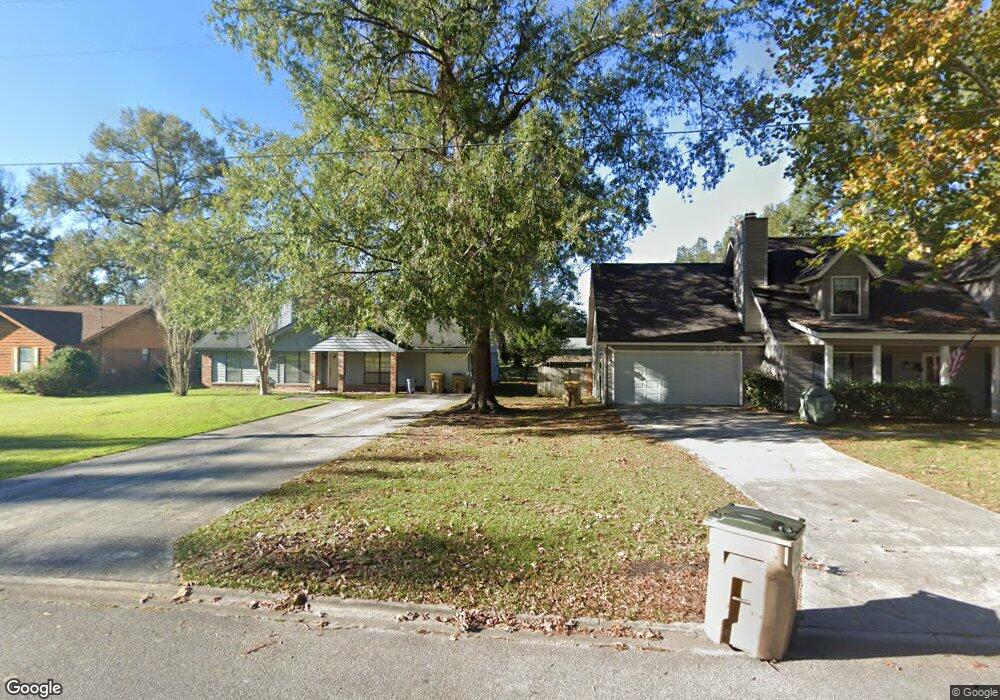
121 Robinson Loop Richmond Hill, GA 31324
Estimated Value: $372,000 - $416,000
4
Beds
2
Baths
1,676
Sq Ft
$237/Sq Ft
Est. Value
About This Home
This home is located at 121 Robinson Loop, Richmond Hill, GA 31324 and is currently estimated at $397,476, approximately $237 per square foot. 121 Robinson Loop is a home located in Bryan County with nearby schools including Frances Meeks Elementary School, Dr. George Washington Carver Elementary School, and Richmond Hill Elementary School.
Ownership History
Date
Name
Owned For
Owner Type
Purchase Details
Closed on
Aug 28, 2007
Sold by
Henderson Stephen B
Bought by
Mock Joel E and Mock Dondi
Current Estimated Value
Home Financials for this Owner
Home Financials are based on the most recent Mortgage that was taken out on this home.
Original Mortgage
$175,200
Outstanding Balance
$111,209
Interest Rate
6.62%
Mortgage Type
New Conventional
Estimated Equity
$286,267
Purchase Details
Closed on
May 12, 2004
Sold by
Henderson Stephen B and Henderson Malissa
Bought by
Henderson Stephen B and Henderson Malissa
Purchase Details
Closed on
Dec 9, 2002
Sold by
Henderson Stephen B
Bought by
Henderson Stephen B and Henderson Malissa
Purchase Details
Closed on
Feb 1, 1998
Bought by
Henderson Stephen B
Purchase Details
Closed on
May 1, 1996
Purchase Details
Closed on
Sep 1, 1987
Create a Home Valuation Report for This Property
The Home Valuation Report is an in-depth analysis detailing your home's value as well as a comparison with similar homes in the area
Home Values in the Area
Average Home Value in this Area
Purchase History
| Date | Buyer | Sale Price | Title Company |
|---|---|---|---|
| Mock Joel E | $219,000 | -- | |
| Henderson Stephen B | -- | -- | |
| Henderson Stephen B | -- | -- | |
| Henderson Stephen B | $127,900 | -- | |
| -- | $75,000 | -- | |
| -- | $222,000 | -- |
Source: Public Records
Mortgage History
| Date | Status | Borrower | Loan Amount |
|---|---|---|---|
| Open | Mock Joel E | $175,200 |
Source: Public Records
Tax History Compared to Growth
Tax History
| Year | Tax Paid | Tax Assessment Tax Assessment Total Assessment is a certain percentage of the fair market value that is determined by local assessors to be the total taxable value of land and additions on the property. | Land | Improvement |
|---|---|---|---|---|
| 2024 | $3,407 | $130,160 | $30,000 | $100,160 |
| 2023 | $3,370 | $94,480 | $30,000 | $64,480 |
| 2022 | $2,634 | $93,280 | $30,000 | $63,280 |
| 2021 | $2,323 | $78,240 | $30,000 | $48,240 |
| 2020 | $1,947 | $78,240 | $30,000 | $48,240 |
| 2019 | $2,361 | $78,000 | $30,000 | $48,000 |
| 2018 | $2,007 | $77,600 | $30,000 | $47,600 |
| 2017 | $1,876 | $77,040 | $30,000 | $47,040 |
| 2016 | $1,830 | $74,480 | $28,000 | $46,480 |
| 2015 | $1,834 | $74,360 | $28,000 | $46,360 |
| 2014 | $1,867 | $75,560 | $28,000 | $47,560 |
Source: Public Records
Map
Nearby Homes
- 67 Oak Side Ct
- 4820 Belfast Keller Rd
- 92 Old Mill Rd E
- 37 Watergrass Way
- 200 Old Mill Rd W
- 614 Savannah Rd
- 1108 Saint Catherine Cir
- 382 Savannah Rd
- 1913 Saint Catherine Cir
- 860 St Catherine Cir
- 860 Saint Catherine Cir
- 268 Catherine View
- 352 Harbour Ln
- 187 Harbour Ln
- 659 Harbour Ln
- 271 Davis Rd
- 385 Marshview Dr
- Oscar Mulberry Plan at Dunham Marsh - The Villas
- Hudson Plan at Dunham Marsh - The Villas
- 301 Marshview Dr
- 45 Oak Side Ct
- 30 Oak Side Ct
- 52 Oak Side Ct
- 27 Oak Side Ct
- 78 Oak Side Ct
- 3 Oak Side Ct
- 241 Oak Pointe Dr
- 221 Oak Pointe Dr
- 114 Oak Side Ct
- 197 Oak Pointe Dr
- 78 Selina Dr
- 259 Oak Pointe Dr
- 88 Selina Dr
- 115 Oak Side Ct
- 149 Oak Pointe Dr
- 139 Oak Side Ct
- 287 Oak Pointe Dr
- 30 Selina Ln
- 30 Selina Ln
- 305 Oak Pointe Dr