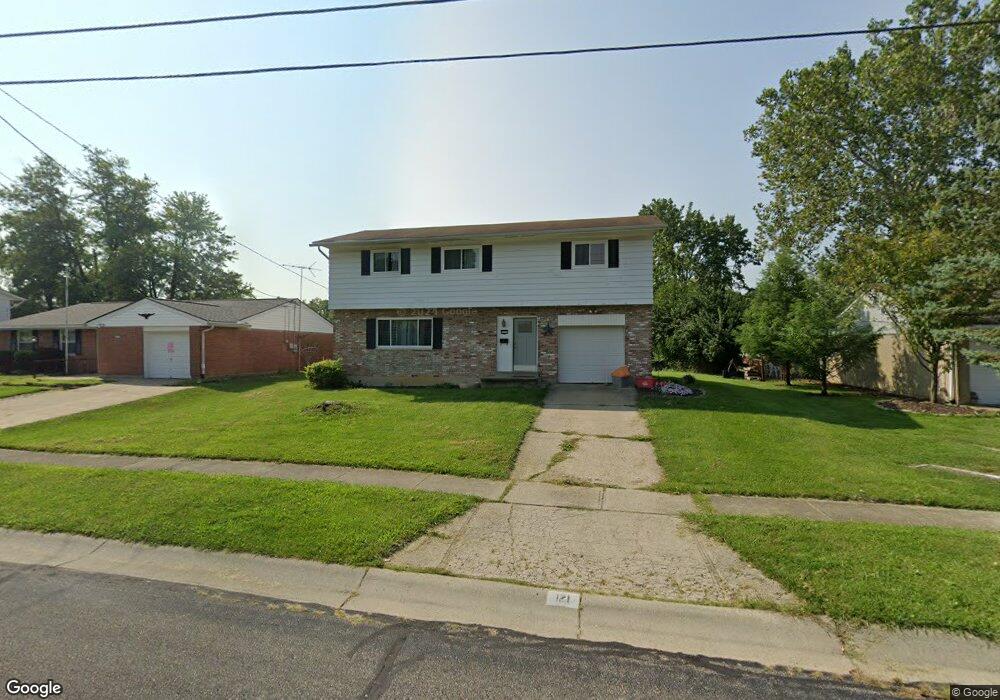
121 Rosetta Ct Cincinnati, OH 45246
Estimated Value: $233,000 - $258,000
4
Beds
3
Baths
1,721
Sq Ft
$143/Sq Ft
Est. Value
About This Home
This home is located at 121 Rosetta Ct, Cincinnati, OH 45246 and is currently estimated at $246,812, approximately $143 per square foot. 121 Rosetta Ct is a home located in Hamilton County with nearby schools including Springdale Elementary School, Princeton Community Middle School, and Princeton High School.
Ownership History
Date
Name
Owned For
Owner Type
Purchase Details
Closed on
Oct 24, 2000
Sold by
Dershimer Karen S and Holland Karen S
Bought by
Horsley Joseph D
Current Estimated Value
Home Financials for this Owner
Home Financials are based on the most recent Mortgage that was taken out on this home.
Original Mortgage
$104,637
Outstanding Balance
$36,566
Interest Rate
7.9%
Mortgage Type
FHA
Estimated Equity
$210,246
Purchase Details
Closed on
Apr 5, 1996
Sold by
Brummett Jeffrey B and Brummett Jerry B
Bought by
Dershimer Mark C and Dershimer Karen S
Home Financials for this Owner
Home Financials are based on the most recent Mortgage that was taken out on this home.
Original Mortgage
$94,400
Interest Rate
7.97%
Create a Home Valuation Report for This Property
The Home Valuation Report is an in-depth analysis detailing your home's value as well as a comparison with similar homes in the area
Home Values in the Area
Average Home Value in this Area
Purchase History
| Date | Buyer | Sale Price | Title Company |
|---|---|---|---|
| Horsley Joseph D | $105,500 | -- | |
| Dershimer Mark C | $99,400 | -- |
Source: Public Records
Mortgage History
| Date | Status | Borrower | Loan Amount |
|---|---|---|---|
| Open | Horsley Joseph D | $104,637 | |
| Previous Owner | Dershimer Mark C | $94,400 |
Source: Public Records
Tax History
| Year | Tax Paid | Tax Assessment Tax Assessment Total Assessment is a certain percentage of the fair market value that is determined by local assessors to be the total taxable value of land and additions on the property. | Land | Improvement |
|---|---|---|---|---|
| 2025 | $3,479 | $69,364 | $12,219 | $57,145 |
| 2023 | $2,996 | $69,364 | $12,219 | $57,145 |
| 2022 | $2,421 | $45,581 | $8,848 | $36,733 |
| 2021 | $2,354 | $45,581 | $8,848 | $36,733 |
| 2020 | $2,383 | $45,581 | $8,848 | $36,733 |
| 2019 | $2,205 | $38,959 | $7,564 | $31,395 |
| 2018 | $2,075 | $38,959 | $7,564 | $31,395 |
| 2017 | $1,947 | $38,959 | $7,564 | $31,395 |
| 2016 | $2,095 | $41,605 | $7,875 | $33,730 |
| 2015 | $2,116 | $41,605 | $7,875 | $33,730 |
| 2014 | $2,123 | $41,605 | $7,875 | $33,730 |
| 2013 | $2,208 | $44,261 | $8,379 | $35,882 |
Source: Public Records
Map
Nearby Homes
- 290 Nelson Ln
- 516 Salzberg Ln
- 237 Eastwick Dr
- 256 Centerbury Ct Unit 67
- 287 Bedford Glen Ln Unit 27
- 10 Woodside Ct
- 11570 Rose Ln
- 18 Oakwood Ct
- 22 Oakwood Ct
- 163 Washington Ave
- 604 Smiley Ave
- 1032 E Crescentville Rd
- 45 S Lake Ave
- 958 Summit Ave
- 38 Providence Dr
- 694 Park Ave
- 1655 E Crescentville Rd
- 440 W Sharon Rd
- 12069 Cantrell Dr
- 2 Clarke Ct
- 117 Rosetta Ct
- 125 Rosetta Ct
- 11811 Neuss Ave
- 11813 Neuss Ave
- 11809 Neuss Ave
- 113 Rosetta Ct
- 129 Rosetta Ct
- 120 Rosetta Ct
- 11815 Neuss Ave
- 124 Rosetta Ct
- 116 Rosetta Ct
- 11807 Neuss Ave
- 128 Rosetta Ct
- 109 Rosetta Ct
- 133 Rosetta Ct
- 112 Rosetta Ct
- 11817 Neuss Ave
- 132 Rosetta Ct
- 11805 Neuss Ave
- 123 Silverwood Cir
Your Personal Tour Guide
Ask me questions while you tour the home.