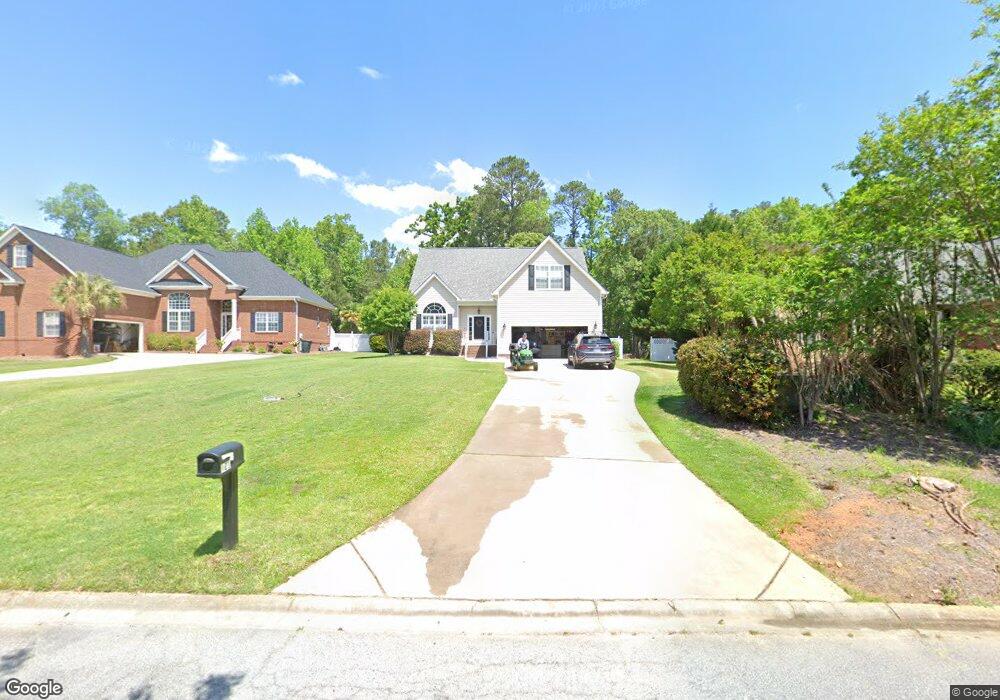
121 Rum Gully Ln Chapin, SC 29036
Estimated Value: $381,000 - $571,000
4
Beds
4
Baths
2,218
Sq Ft
$197/Sq Ft
Est. Value
About This Home
This home is located at 121 Rum Gully Ln, Chapin, SC 29036 and is currently estimated at $437,710, approximately $197 per square foot. 121 Rum Gully Ln is a home located in Lexington County with nearby schools including Chapin Elementary School, Chapin Intermediate, and Chapin High School.
Ownership History
Date
Name
Owned For
Owner Type
Purchase Details
Closed on
Aug 23, 2021
Sold by
Anderson Vanessa J and Camp Joseph S
Bought by
Cybart John J and Cybart Gloria L
Current Estimated Value
Home Financials for this Owner
Home Financials are based on the most recent Mortgage that was taken out on this home.
Original Mortgage
$148,501
Outstanding Balance
$134,337
Interest Rate
2.9%
Mortgage Type
New Conventional
Estimated Equity
$303,373
Purchase Details
Closed on
Apr 13, 2018
Sold by
Anderson Vanessa J
Bought by
Anderson Vanessa J and Camp Joseph S
Purchase Details
Closed on
Jun 27, 2016
Sold by
Raymond J Nault
Bought by
Camp Joseph
Home Financials for this Owner
Home Financials are based on the most recent Mortgage that was taken out on this home.
Original Mortgage
$12,750
Interest Rate
3.56%
Purchase Details
Closed on
Jul 2, 2014
Sold by
Anderson Kevin C
Bought by
Anderson Vanessa J
Create a Home Valuation Report for This Property
The Home Valuation Report is an in-depth analysis detailing your home's value as well as a comparison with similar homes in the area
Home Values in the Area
Average Home Value in this Area
Purchase History
| Date | Buyer | Sale Price | Title Company |
|---|---|---|---|
| Cybart John J | $290,500 | None Available | |
| Anderson Vanessa J | -- | None Available | |
| Camp Joseph | -- | -- | |
| Anderson Vanessa J | -- | -- |
Source: Public Records
Mortgage History
| Date | Status | Borrower | Loan Amount |
|---|---|---|---|
| Open | Cybart John J | $148,501 | |
| Previous Owner | Camp Joseph | $12,750 | |
| Previous Owner | Camp Joseph | -- |
Source: Public Records
Tax History Compared to Growth
Tax History
| Year | Tax Paid | Tax Assessment Tax Assessment Total Assessment is a certain percentage of the fair market value that is determined by local assessors to be the total taxable value of land and additions on the property. | Land | Improvement |
|---|---|---|---|---|
| 2024 | $1,801 | $11,771 | $1,600 | $10,171 |
| 2023 | $1,801 | $11,620 | $1,600 | $10,020 |
| 2022 | $1,794 | $11,620 | $1,600 | $10,020 |
| 2020 | $1,355 | $8,383 | $1,567 | $6,816 |
| 2019 | $1,199 | $7,289 | $1,100 | $6,189 |
| 2018 | $1,055 | $7,289 | $1,100 | $6,189 |
| 2017 | $1,028 | $7,289 | $1,100 | $6,189 |
| 2016 | $1,054 | $7,288 | $1,100 | $6,188 |
| 2014 | $1,092 | $7,582 | $1,100 | $6,482 |
| 2013 | -- | $7,580 | $1,100 | $6,480 |
Source: Public Records
Map
Nearby Homes
- 140 Rum Gully Ln
- 1040 Night Harbor Cir
- 190 Hunter Dr
- 161 Nel-La Ln
- Sabel Plan at Night Harbor
- Azalea Plan at Night Harbor
- Edisto II Plan at Night Harbor
- Magnolia Plan at Night Harbor
- Carol Plan at Night Harbor
- 249 Daymark Dr
- 1304 Amicks Ferry Rd
- 0 Greengarden Dr Unit T 601550
- 0 Greengarden Dr Unit Q 601548
- 0 Greengarden Dr Unit W 600899
- 0 Greengarden Dr Unit V 600897
- 0 Greengarden Dr Unit U 600740
- 0 Greengarden Dr Unit A 600737
- 0 Greengarden Dr Unit P 600736
- 0 Greengarden Dr Unit 600735
- 842 Misty Harbor Rd
- 125 Rum Gully Ln
- 117 Rum Gully Ln
- 129 Rum Gully Ln
- 133 Rum Gully Ln
- 116 Rum Gully Ln
- 112 Rum Gully Ln
- 109 Rum Gully Ln
- 108 Rum Gully Ln
- 124 Rum Gully Ln
- 105 Rum Gully Ln
- 228 Shady Acres Dr
- 104 Rum Gully Ln
- 101 Rum Gully Ln
- 100 Rum Gully Ln
- 136 Rum Gully Ln
- 132 Rum Gully Ln
- 239 Shady Acres Dr
- 220 Shady Acres Dr
- 360 Flicker Ln
- 324 Wingo Ct