Estimated Value: $80,227 - $90,000
2
Beds
1
Bath
1,276
Sq Ft
$66/Sq Ft
Est. Value
About This Home
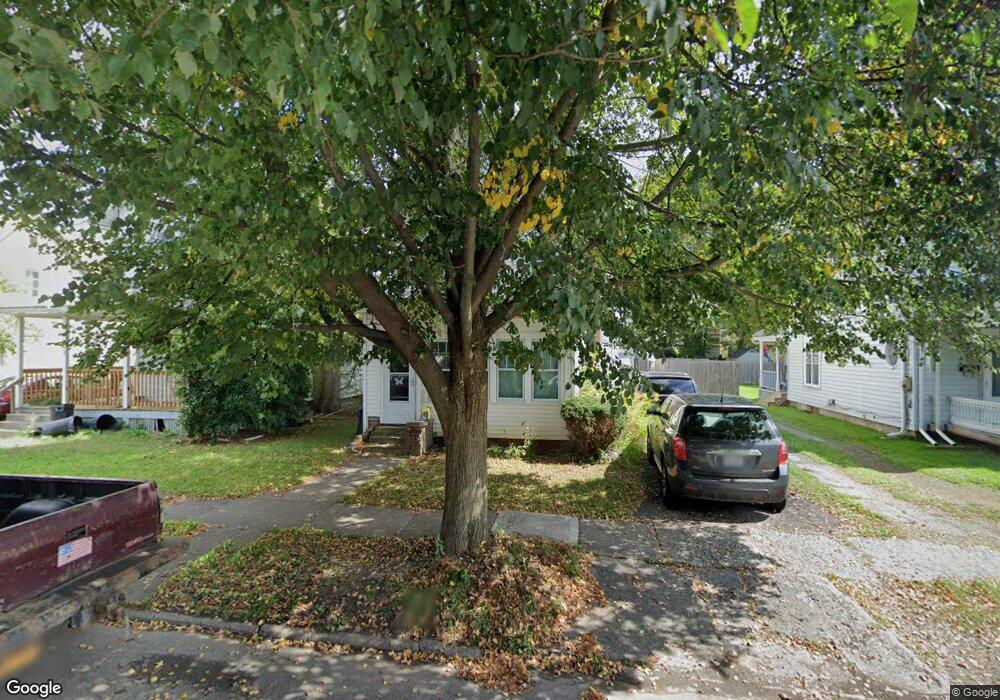
This home is located at 121 S 12th St, Olean, NY 14760 and is currently estimated at $83,807, approximately $65 per square foot. 121 S 12th St is a home located in Cattaraugus County with nearby schools including Olean Intermediate-Middle School, Olean Senior High School, and Southern Tier Catholic School.
Ownership History
Date
Name
Owned For
Owner Type
Purchase Details
Closed on
Aug 24, 2023
Sold by
Bernstein Alan and Bernstein Paula M
Bought by
Daniels James C and French Alyia M
Current Estimated Value
Home Financials for this Owner
Home Financials are based on the most recent Mortgage that was taken out on this home.
Original Mortgage
$49,094
Outstanding Balance
$48,006
Interest Rate
6.96%
Mortgage Type
FHA
Estimated Equity
$35,801
Purchase Details
Closed on
May 18, 2012
Sold by
Bernstein Alan
Bought by
Bernstein Alan
Create a Home Valuation Report for This Property
The Home Valuation Report is an in-depth analysis detailing your home's value as well as a comparison with similar homes in the area
Home Values in the Area
Average Home Value in this Area
Purchase History
| Date | Buyer | Sale Price | Title Company |
|---|---|---|---|
| Daniels James C | $50,000 | None Available | |
| Bernstein Alan | -- | -- |
Source: Public Records
Mortgage History
| Date | Status | Borrower | Loan Amount |
|---|---|---|---|
| Open | Daniels James C | $49,094 |
Source: Public Records
Tax History
| Year | Tax Paid | Tax Assessment Tax Assessment Total Assessment is a certain percentage of the fair market value that is determined by local assessors to be the total taxable value of land and additions on the property. | Land | Improvement |
|---|---|---|---|---|
| 2024 | $3,225 | $51,000 | $4,000 | $47,000 |
| 2023 | $1,920 | $51,000 | $4,000 | $47,000 |
| 2022 | $1,948 | $51,000 | $4,000 | $47,000 |
| 2021 | $2,004 | $51,000 | $4,000 | $47,000 |
| 2020 | $2,018 | $51,000 | $4,000 | $47,000 |
| 2019 | $766 | $51,000 | $4,000 | $47,000 |
| 2018 | $2,751 | $51,000 | $4,000 | $47,000 |
| 2017 | $2,067 | $51,000 | $4,000 | $47,000 |
| 2016 | $3,498 | $51,000 | $4,000 | $47,000 |
| 2015 | -- | $51,000 | $4,000 | $47,000 |
| 2014 | -- | $51,000 | $4,000 | $47,000 |
Source: Public Records
Map
Nearby Homes
Your Personal Tour Guide
Ask me questions while you tour the home.