Estimated Value: $533,000 - $658,000
--
Bed
--
Bath
3,114
Sq Ft
$190/Sq Ft
Est. Value
About This Home
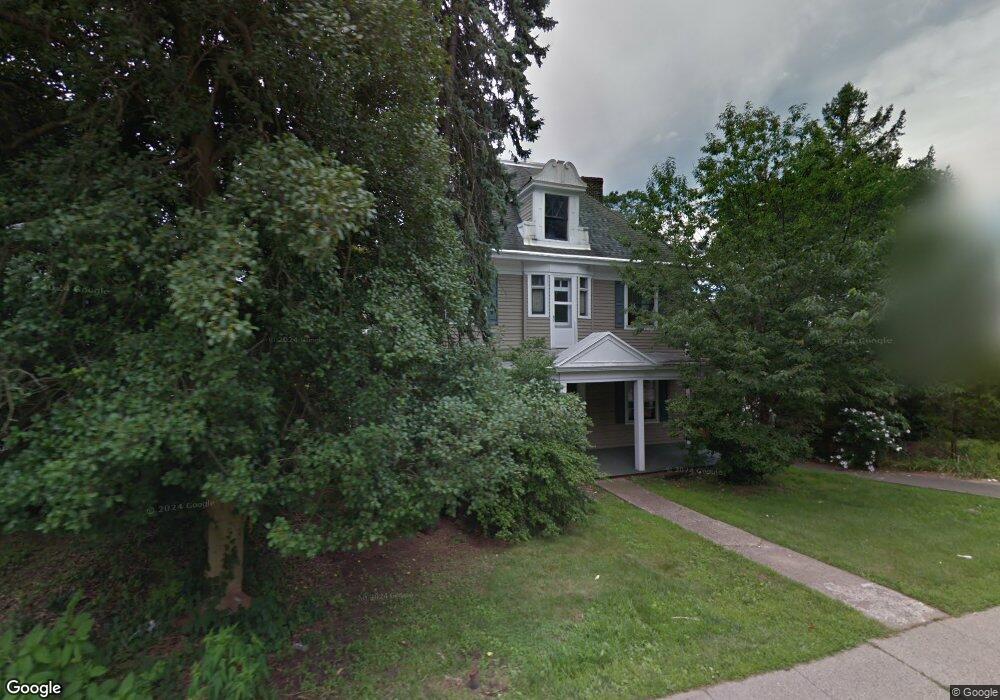
This home is located at 121 S Morris St, Dover, NJ 07801 and is currently estimated at $590,380, approximately $189 per square foot. 121 S Morris St is a home located in Morris County with nearby schools including Dover Middle School, Dover High School, and Apple Montessori Schools and Camps - Randolph.
Ownership History
Date
Name
Owned For
Owner Type
Purchase Details
Closed on
Jul 21, 2017
Sold by
Lopez Jaime and Remeche Sara
Bought by
Aventine Invstments Llc
Current Estimated Value
Purchase Details
Closed on
Nov 4, 2005
Sold by
Sands Russell B
Bought by
Lopez Jaime and Remache Sara
Home Financials for this Owner
Home Financials are based on the most recent Mortgage that was taken out on this home.
Original Mortgage
$87,600
Interest Rate
6.07%
Mortgage Type
Stand Alone Second
Purchase Details
Closed on
Jan 30, 2004
Sold by
Lee Richard
Bought by
Sands Russell and Sands Susan
Home Financials for this Owner
Home Financials are based on the most recent Mortgage that was taken out on this home.
Original Mortgage
$264,000
Interest Rate
5.8%
Create a Home Valuation Report for This Property
The Home Valuation Report is an in-depth analysis detailing your home's value as well as a comparison with similar homes in the area
Home Values in the Area
Average Home Value in this Area
Purchase History
| Date | Buyer | Sale Price | Title Company |
|---|---|---|---|
| Aventine Invstments Llc | $150,800 | None Available | |
| Lopez Jaime | $438,000 | -- | |
| Sands Russell | $330,000 | -- |
Source: Public Records
Mortgage History
| Date | Status | Borrower | Loan Amount |
|---|---|---|---|
| Previous Owner | Lopez Jaime | $87,600 | |
| Previous Owner | Sands Russell | $264,000 |
Source: Public Records
Tax History Compared to Growth
Tax History
| Year | Tax Paid | Tax Assessment Tax Assessment Total Assessment is a certain percentage of the fair market value that is determined by local assessors to be the total taxable value of land and additions on the property. | Land | Improvement |
|---|---|---|---|---|
| 2025 | $11,933 | $364,600 | $75,200 | $289,400 |
| 2024 | $11,510 | $364,600 | $75,200 | $289,400 |
| 2023 | $11,510 | $364,600 | $75,200 | $289,400 |
| 2022 | $10,584 | $364,600 | $75,200 | $289,400 |
| 2021 | $10,584 | $364,600 | $75,200 | $289,400 |
| 2020 | $10,373 | $364,600 | $75,200 | $289,400 |
| 2019 | $9,943 | $364,600 | $75,200 | $289,400 |
| 2018 | $9,396 | $364,600 | $75,200 | $289,400 |
| 2017 | $8,969 | $364,600 | $75,200 | $289,400 |
| 2016 | $8,758 | $364,600 | $75,200 | $289,400 |
| 2015 | $8,222 | $400,100 | $127,100 | $273,000 |
| 2014 | $8,138 | $400,100 | $127,100 | $273,000 |
Source: Public Records
Map
Nearby Homes
- 48 Byram Ave
- 104 Jordan Terrace
- 37 1st St
- 24 Livingston Ave
- 41 Livingston Ave
- 61 W Munson Ave
- 60 A E Black Well St
- 51 N Morris St
- 134 W Munson Ave
- 68 Grant St
- 164 E Blackwell St Unit 166
- 119 Millbrook Ave
- 142 W Blackwell St
- 191 E Blackwell St Abcd
- 203 E Black Well St Abc Unit ABC
- 207 E Blackwell St
- 335 S Morris St
- 11 Front St
- 25 Watson Dr
- 20 Victory Ct Unit 21A