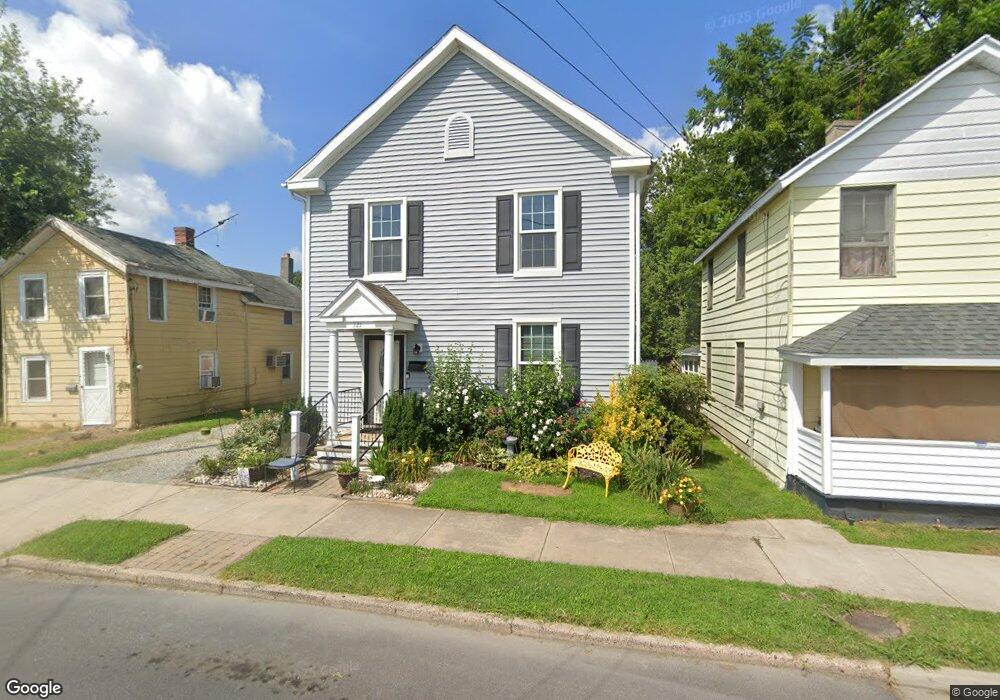
121 S West St Easton, MD 21601
Estimated Value: $186,000 - $373,000
--
Bed
2
Baths
1,344
Sq Ft
$212/Sq Ft
Est. Value
About This Home
This home is located at 121 S West St, Easton, MD 21601 and is currently estimated at $284,454, approximately $211 per square foot. 121 S West St is a home located in Talbot County with nearby schools including Easton Elementary School, Easton Middle School, and Easton High School.
Ownership History
Date
Name
Owned For
Owner Type
Purchase Details
Closed on
Aug 28, 2007
Sold by
Easton Village Llc
Bought by
Slacum Sharon A
Current Estimated Value
Home Financials for this Owner
Home Financials are based on the most recent Mortgage that was taken out on this home.
Original Mortgage
$101,800
Outstanding Balance
$72,266
Interest Rate
6.71%
Mortgage Type
Purchase Money Mortgage
Estimated Equity
$212,188
Purchase Details
Closed on
Aug 17, 2007
Sold by
Easton Village Llc
Bought by
Slacum Sharon A
Home Financials for this Owner
Home Financials are based on the most recent Mortgage that was taken out on this home.
Original Mortgage
$101,800
Outstanding Balance
$72,266
Interest Rate
6.71%
Mortgage Type
Purchase Money Mortgage
Estimated Equity
$212,188
Purchase Details
Closed on
Jan 12, 2006
Sold by
Memorial Hospital
Bought by
Easton Village Llc
Purchase Details
Closed on
Aug 22, 2005
Sold by
Memorial Hospital
Bought by
Easton Village Llc
Create a Home Valuation Report for This Property
The Home Valuation Report is an in-depth analysis detailing your home's value as well as a comparison with similar homes in the area
Home Values in the Area
Average Home Value in this Area
Purchase History
| Date | Buyer | Sale Price | Title Company |
|---|---|---|---|
| Slacum Sharon A | $97,000 | -- | |
| Slacum Sharon A | $97,000 | -- | |
| Easton Village Llc | $80,000 | -- | |
| Easton Village Llc | $80,000 | -- |
Source: Public Records
Mortgage History
| Date | Status | Borrower | Loan Amount |
|---|---|---|---|
| Open | Slacum Sharon A | $101,800 | |
| Closed | Slacum Sharon A | $101,800 |
Source: Public Records
Tax History Compared to Growth
Tax History
| Year | Tax Paid | Tax Assessment Tax Assessment Total Assessment is a certain percentage of the fair market value that is determined by local assessors to be the total taxable value of land and additions on the property. | Land | Improvement |
|---|---|---|---|---|
| 2025 | $916 | $165,267 | $0 | $0 |
| 2024 | $916 | $156,600 | $41,400 | $115,200 |
| 2023 | $851 | $146,200 | $0 | $0 |
| 2022 | $770 | $135,800 | $0 | $0 |
| 2021 | $704 | $125,400 | $35,000 | $90,400 |
| 2020 | $704 | $121,500 | $0 | $0 |
| 2019 | $699 | $117,600 | $0 | $0 |
| 2018 | $665 | $113,700 | $30,000 | $83,700 |
| 2017 | $625 | $113,700 | $0 | $0 |
| 2016 | $598 | $113,700 | $0 | $0 |
| 2015 | $527 | $117,000 | $0 | $0 |
| 2014 | $527 | $117,000 | $0 | $0 |
Source: Public Records
Map
Nearby Homes
- 11 Brookletts Ave
- 33 S Harrison St
- 26 S Washington St
- 220 W Dover St
- 115 South St
- 222 W Dover St
- 205 S Hanson St
- 202 Tubman Dr
- 133 N Washington St
- 203 E Earle Ave
- 13 N Thoroughgood Ln
- 227 Bethune Dr
- 20 S Aurora St
- 305 S Aurora St
- 304 Wheatley Dr
- 412 Trippe Ave
- 30 Kelley Gibson St
- 12b Mistletoe Dr
- 295 Bay St Unit 4
- 414 S Aurora St