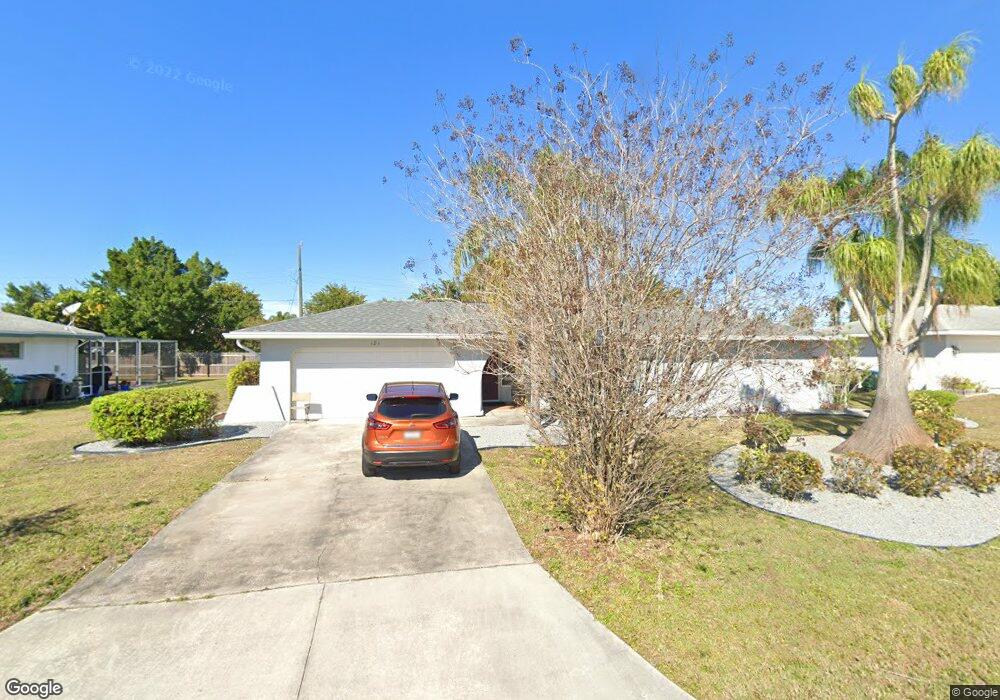
121 SE 45th Terrace Unit 30 Cape Coral, FL 33904
Bimini Basin NeighborhoodEstimated Value: $284,000 - $308,000
3
Beds
2
Baths
2,107
Sq Ft
$142/Sq Ft
Est. Value
About This Home
This home is located at 121 SE 45th Terrace Unit 30, Cape Coral, FL 33904 and is currently estimated at $298,841, approximately $141 per square foot. 121 SE 45th Terrace Unit 30 is a home located in Lee County with nearby schools including Cape Elementary School, Caloosa Elementary School, and Tropic Isles Elementary School.
Ownership History
Date
Name
Owned For
Owner Type
Purchase Details
Closed on
Mar 17, 2025
Sold by
Zammerilla Linda Schwartz
Bought by
Lastra Senen
Current Estimated Value
Home Financials for this Owner
Home Financials are based on the most recent Mortgage that was taken out on this home.
Original Mortgage
$299,475
Outstanding Balance
$297,875
Interest Rate
6.65%
Mortgage Type
New Conventional
Estimated Equity
$966
Purchase Details
Closed on
Mar 28, 2005
Sold by
Schwartz William J
Bought by
Zammerilla Linda Schwartz
Purchase Details
Closed on
Jun 28, 2004
Sold by
Schwartz Richard M
Bought by
Zammerilla Linda Schwartz
Purchase Details
Closed on
Apr 20, 2004
Sold by
Schwartz Reynolds Karen Elaine and Schwartz Reynolds Karen Elaine
Bought by
Zammerilla Linda Schwartz
Create a Home Valuation Report for This Property
The Home Valuation Report is an in-depth analysis detailing your home's value as well as a comparison with similar homes in the area
Home Values in the Area
Average Home Value in this Area
Purchase History
| Date | Buyer | Sale Price | Title Company |
|---|---|---|---|
| Lastra Senen | $305,000 | E C Title Services | |
| Zammerilla Linda Schwartz | $23,600 | -- | |
| Zammerilla Linda Schwartz | -- | -- | |
| Zammerilla Linda Schwartz | -- | -- |
Source: Public Records
Mortgage History
| Date | Status | Borrower | Loan Amount |
|---|---|---|---|
| Open | Lastra Senen | $299,475 |
Source: Public Records
Tax History Compared to Growth
Tax History
| Year | Tax Paid | Tax Assessment Tax Assessment Total Assessment is a certain percentage of the fair market value that is determined by local assessors to be the total taxable value of land and additions on the property. | Land | Improvement |
|---|---|---|---|---|
| 2025 | $2,770 | $172,178 | -- | -- |
| 2024 | $2,770 | $167,326 | -- | -- |
| 2023 | $2,637 | $157,452 | $0 | $0 |
| 2022 | $2,498 | $157,220 | $0 | $0 |
| 2021 | $2,508 | $172,383 | $27,300 | $145,083 |
| 2020 | $2,524 | $151,012 | $27,300 | $123,712 |
| 2019 | $3,188 | $147,776 | $27,300 | $120,476 |
| 2018 | $3,012 | $135,665 | $26,000 | $109,665 |
| 2017 | $2,901 | $134,853 | $20,000 | $114,853 |
| 2016 | $2,624 | $115,565 | $20,000 | $95,565 |
| 2015 | $2,429 | $101,804 | $15,300 | $86,504 |
| 2014 | -- | $95,511 | $13,700 | $81,811 |
| 2013 | -- | $87,495 | $9,800 | $77,695 |
Source: Public Records
Map
Nearby Homes
- 133 SE 45th St
- 136 SE 45th Terrace
- 4502 Santa Barbara Blvd
- 4508 Santa Barbara Blvd Unit 102
- 4514 Santa Barbara Blvd Unit 5
- 101 SE 44th Terrace
- 4516 Santa Barbara Blvd Unit 3
- 116 SE 46th St
- 137 SE 44th Terrace
- 4412 Santa Barbara Blvd
- 4402 Santa Barbara Blvd
- 4426 SW Santa Barbara Place
- 4524 SE 1st Place
- 127 SE 43rd Ln
- 206 SE 45th Terrace
- 219 SE 46th Terrace
- 212 SE 45th St
- 213 SE 47th St
- 4641 SW Santa Barbara Place Unit 8
- 4641 SW Santa Barbara Place Unit 5
- 117 SE 45th Terrace
- 124 SE 45th St
- 120 SE 45th St
- 124 SE 45th Terrace
- 129 SE 45th Terrace
- 128 SE 45th St
- 113 SE 45th Terrace
- 116 SE 45th St
- 120 SE 45th Terrace
- 128 SE 45th Terrace
- 116 SE 45th Terrace
- 132 SE 45th St
- 112 SE 45th St
- 133 SE 45th Terrace
- 109 SE 45th Terrace Unit 2
- 121 SE 45th St
- 112 SE 45th Terrace
- 125 SE 45th St
- 123 SE 46th St
- 117 SE 45th St