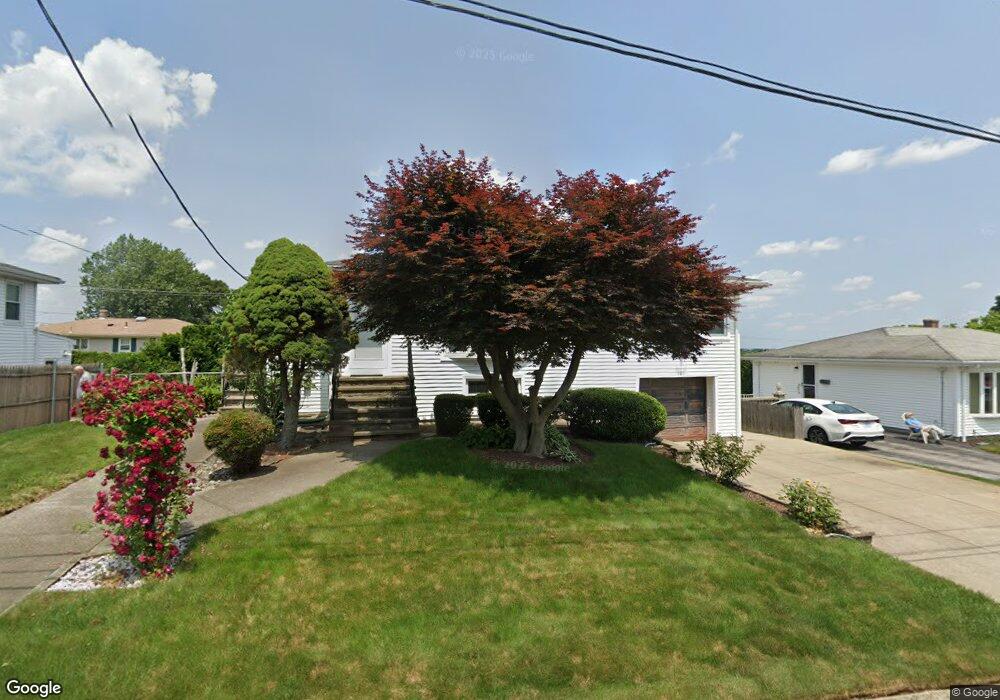
121 Selma St Cranston, RI 02920
Budlong NeighborhoodEstimated Value: $416,091 - $497,000
2
Beds
2
Baths
1,182
Sq Ft
$385/Sq Ft
Est. Value
About This Home
This home is located at 121 Selma St, Cranston, RI 02920 and is currently estimated at $454,523, approximately $384 per square foot. 121 Selma St is a home located in Providence County with nearby schools including Woodridge Elementary School, Western Hills Middle School, and Cranston High School West.
Ownership History
Date
Name
Owned For
Owner Type
Purchase Details
Closed on
Oct 19, 2001
Sold by
Rossi Robert D and Rossi Marie
Bought by
Igolnikov Igor and Igolnikov Maria
Current Estimated Value
Home Financials for this Owner
Home Financials are based on the most recent Mortgage that was taken out on this home.
Original Mortgage
$136,000
Interest Rate
6.92%
Create a Home Valuation Report for This Property
The Home Valuation Report is an in-depth analysis detailing your home's value as well as a comparison with similar homes in the area
Home Values in the Area
Average Home Value in this Area
Purchase History
| Date | Buyer | Sale Price | Title Company |
|---|---|---|---|
| Igolnikov Igor | $170,000 | -- |
Source: Public Records
Mortgage History
| Date | Status | Borrower | Loan Amount |
|---|---|---|---|
| Open | Igolnikov Igor | $136,000 | |
| Closed | Igolnikov Igor | $136,000 | |
| Previous Owner | Igolnikov Igor | $80,000 |
Source: Public Records
Tax History
| Year | Tax Paid | Tax Assessment Tax Assessment Total Assessment is a certain percentage of the fair market value that is determined by local assessors to be the total taxable value of land and additions on the property. | Land | Improvement |
|---|---|---|---|---|
| 2025 | $4,908 | $353,600 | $109,400 | $244,200 |
| 2024 | $4,812 | $353,600 | $109,400 | $244,200 |
| 2023 | $4,640 | $245,500 | $72,000 | $173,500 |
| 2022 | $4,544 | $245,500 | $72,000 | $173,500 |
| 2021 | $4,419 | $245,500 | $72,000 | $173,500 |
| 2020 | $4,164 | $200,500 | $68,600 | $131,900 |
| 2019 | $4,164 | $200,500 | $68,600 | $131,900 |
| 2018 | $4,068 | $200,500 | $68,600 | $131,900 |
| 2017 | $3,836 | $167,200 | $61,800 | $105,400 |
| 2016 | $3,754 | $167,200 | $61,800 | $105,400 |
| 2015 | $3,754 | $167,200 | $61,800 | $105,400 |
| 2014 | $3,981 | $174,300 | $61,800 | $112,500 |
Source: Public Records
Map
Nearby Homes
- 80 W View Ave
- 69 W View Ave
- 99 Salem Ave
- 129 Vallette St
- 75 Macbeth St
- 58 Meredith Dr
- 84 N View Ave
- 0 Hayes St Unit 1409459
- 135 Meshanticut Valley Pkwy
- 141 Glen Ridge Rd
- 2037 Cranston St
- 71 Norton Ave
- 148 Wayland Ave
- 46 Roslyn Ave
- 242 Brettonwoods Dr
- 29 Poppy Dr
- 84 Intervale Rd
- 85 Vermont St
- 239 Ausdale Rd
- 13 Pine St
Your Personal Tour Guide
Ask me questions while you tour the home.