Estimated Value: $115,000 - $275,258
--
Bed
1
Bath
1,008
Sq Ft
$169/Sq Ft
Est. Value
About This Home
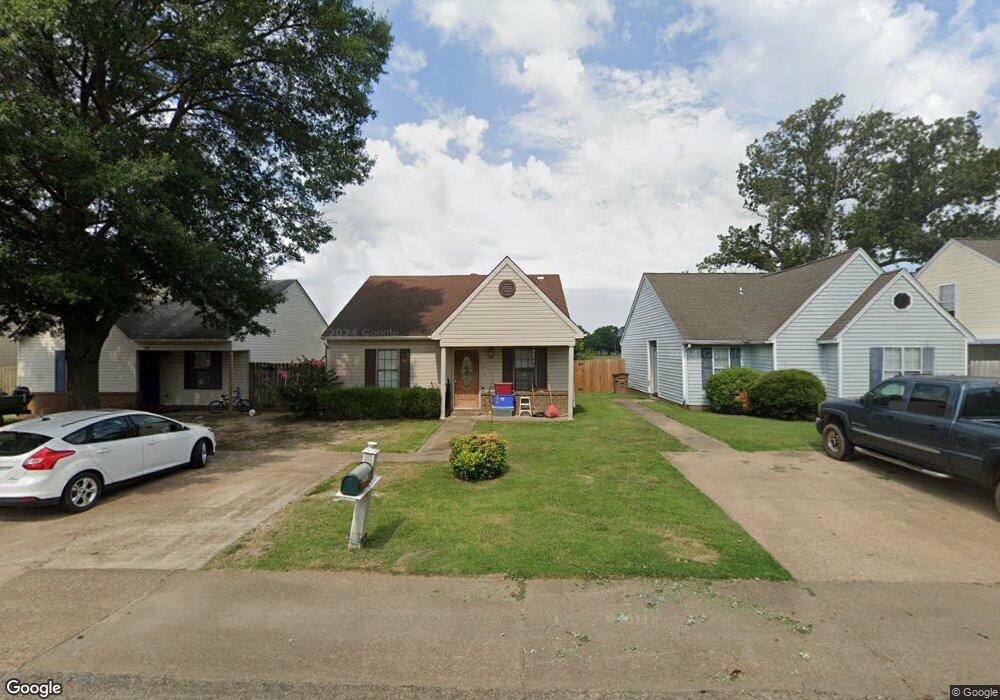
This home is located at 121 Sequoia St, Wynne, AR 72396 and is currently estimated at $170,815, approximately $169 per square foot. 121 Sequoia St is a home located in Cross County with nearby schools including Wynne Primary School, Wynne Intermediate School, and Wynne Junior High School.
Ownership History
Date
Name
Owned For
Owner Type
Purchase Details
Closed on
Mar 12, 2025
Sold by
Fisher & Fisher Investments
Bought by
Fisher Properties Llc
Current Estimated Value
Home Financials for this Owner
Home Financials are based on the most recent Mortgage that was taken out on this home.
Original Mortgage
$443,827
Outstanding Balance
$434,593
Interest Rate
6.05%
Mortgage Type
New Conventional
Estimated Equity
-$263,778
Purchase Details
Closed on
Jun 27, 2007
Sold by
Morales Hylie Jonathan and Morales Hylie Milena
Bought by
Hicky Phil
Purchase Details
Closed on
Jul 26, 2006
Sold by
Pyland Bryan
Bought by
Fisher & Fisher Investments
Purchase Details
Closed on
Apr 5, 2004
Bought by
Pyland Brian
Purchase Details
Closed on
Dec 21, 1993
Bought by
Ramsey John S
Purchase Details
Closed on
Nov 17, 1993
Bought by
Jones Donald and Jones Connie J
Purchase Details
Closed on
Apr 5, 1993
Bought by
Jones Donald and Jones Connie J
Create a Home Valuation Report for This Property
The Home Valuation Report is an in-depth analysis detailing your home's value as well as a comparison with similar homes in the area
Home Values in the Area
Average Home Value in this Area
Purchase History
| Date | Buyer | Sale Price | Title Company |
|---|---|---|---|
| Fisher Properties Llc | -- | None Listed On Document | |
| Hicky Phil | -- | None Available | |
| Fisher & Fisher Investments | $57,000 | None Available | |
| Pyland Brian | $52,000 | -- | |
| Ramsey John S | $47,000 | -- | |
| Jones Donald | -- | -- | |
| Jones Donald | -- | -- |
Source: Public Records
Mortgage History
| Date | Status | Borrower | Loan Amount |
|---|---|---|---|
| Open | Fisher Properties Llc | $443,827 |
Source: Public Records
Tax History Compared to Growth
Tax History
| Year | Tax Paid | Tax Assessment Tax Assessment Total Assessment is a certain percentage of the fair market value that is determined by local assessors to be the total taxable value of land and additions on the property. | Land | Improvement |
|---|---|---|---|---|
| 2024 | $519 | $10,510 | $1,800 | $8,710 |
| 2023 | $520 | $10,510 | $1,800 | $8,710 |
| 2022 | $520 | $10,510 | $1,800 | $8,710 |
| 2021 | $520 | $10,510 | $1,800 | $8,710 |
| 2020 | $515 | $10,510 | $1,800 | $8,710 |
| 2019 | $468 | $9,460 | $1,540 | $7,920 |
| 2018 | $468 | $9,460 | $1,540 | $7,920 |
| 2017 | $468 | $9,460 | $1,540 | $7,920 |
| 2016 | $468 | $9,460 | $1,540 | $7,920 |
| 2015 | $468 | $9,460 | $1,540 | $7,920 |
| 2014 | $525 | $10,600 | $1,600 | $9,000 |
Source: Public Records
Map
Nearby Homes
- 104 Shawnee
- 105 Chickasaw
- 733 Martin Dr E
- 1321 Martin Dr E
- 701 Wren St
- 704 Mockingbird Ln
- 712 Mockingbird Ln
- 0 0 Unit 24023180
- 129 Lombardy Ln
- 102 Lombardy Ln
- 903 Levesque Ave E
- 116 Bailey St S
- 23 Southridge Cir
- 206 Maple Dr
- 314 Mildred Dr E
- 43 Southridge Cir
- 908 Block St S
- 323 Clifton Dr
- 919 Hamilton Ave E
- 2 Donegal Cir