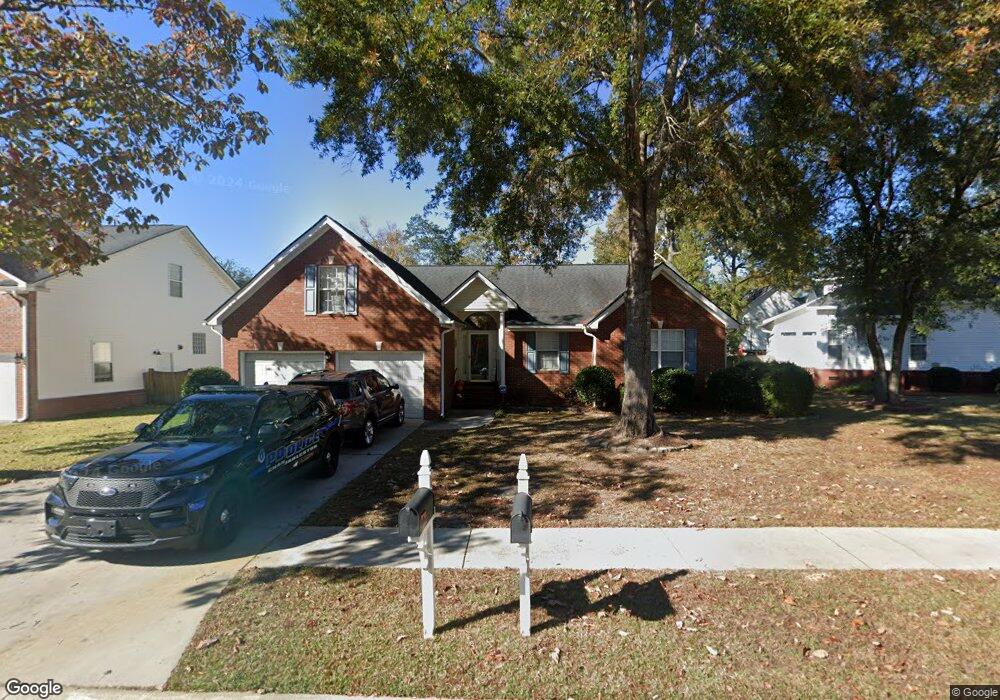
121 Spalding Cir Goose Creek, SC 29445
Estimated Value: $414,472 - $471,000
4
Beds
2
Baths
2,087
Sq Ft
$214/Sq Ft
Est. Value
About This Home
This home is located at 121 Spalding Cir, Goose Creek, SC 29445 and is currently estimated at $445,618, approximately $213 per square foot. 121 Spalding Cir is a home located in Berkeley County with nearby schools including College Park Elementary School, College Park Middle School, and Stratford High School.
Ownership History
Date
Name
Owned For
Owner Type
Purchase Details
Closed on
Jul 28, 2014
Sold by
Aaron Nathan M and Aaron Kimberly J
Bought by
Lysdal Christina Marie
Current Estimated Value
Home Financials for this Owner
Home Financials are based on the most recent Mortgage that was taken out on this home.
Original Mortgage
$221,350
Outstanding Balance
$169,282
Interest Rate
4.19%
Mortgage Type
Future Advance Clause Open End Mortgage
Estimated Equity
$276,336
Purchase Details
Closed on
May 24, 2010
Sold by
Nesmith Nell C
Bought by
Aaron Nathan M and Aaron Kimberly J
Home Financials for this Owner
Home Financials are based on the most recent Mortgage that was taken out on this home.
Original Mortgage
$238,106
Interest Rate
5.02%
Mortgage Type
VA
Purchase Details
Closed on
Oct 16, 2000
Sold by
Altman Group The
Bought by
Nesmith Marvin E and Nesmith Nell C
Purchase Details
Closed on
Nov 18, 1999
Sold by
Dameshighi Michael J
Bought by
The Altman Group Llc
Create a Home Valuation Report for This Property
The Home Valuation Report is an in-depth analysis detailing your home's value as well as a comparison with similar homes in the area
Home Values in the Area
Average Home Value in this Area
Purchase History
| Date | Buyer | Sale Price | Title Company |
|---|---|---|---|
| Lysdal Christina Marie | $233,000 | -- | |
| Aaron Nathan M | $230,500 | -- | |
| Nesmith Marvin E | $190,000 | -- | |
| The Altman Group Llc | $38,000 | -- |
Source: Public Records
Mortgage History
| Date | Status | Borrower | Loan Amount |
|---|---|---|---|
| Open | Lysdal Christina Marie | $221,350 | |
| Previous Owner | Aaron Nathan M | $238,106 |
Source: Public Records
Tax History Compared to Growth
Tax History
| Year | Tax Paid | Tax Assessment Tax Assessment Total Assessment is a certain percentage of the fair market value that is determined by local assessors to be the total taxable value of land and additions on the property. | Land | Improvement |
|---|---|---|---|---|
| 2025 | $1,503 | $290,950 | $63,397 | $227,553 |
| 2024 | $1,503 | $11,638 | $2,536 | $9,102 |
| 2023 | $1,503 | $11,638 | $2,243 | $9,395 |
| 2022 | $1,482 | $10,120 | $3,152 | $6,968 |
| 2021 | $1,605 | $10,120 | $3,152 | $6,968 |
| 2020 | $1,529 | $10,120 | $3,152 | $6,968 |
| 2019 | $1,470 | $10,120 | $3,152 | $6,968 |
| 2018 | $1,370 | $9,116 | $2,800 | $6,316 |
| 2017 | $1,360 | $9,116 | $2,800 | $6,316 |
| 2016 | $1,370 | $9,120 | $2,800 | $6,320 |
| 2015 | $1,284 | $9,120 | $2,800 | $6,320 |
| 2014 | $2,466 | $9,240 | $2,800 | $6,440 |
| 2013 | -- | $9,240 | $2,800 | $6,440 |
Source: Public Records
Map
Nearby Homes
- 108 Paige Ct
- 1110 Wilhite Dr
- 102 David John Ct
- 1084 Wilhite Dr
- 125 Eston Dr
- 100 Iken Cir
- 103 Tunstall Dr
- 104 Chedburg Dr
- 101 S Gateshead Crossing
- 109 Waveney Cir
- 100 N Gateshead Crossing
- 105 N Gateshead Crossing
- 697 Hamlet Cir
- 101 N Warwick Trace
- 212 Hamlet Cir
- 109 S Norfolk Way
- 102 Winding Rock Rd
- 100 Conset Bay Ct
- 135 Commons Way
- 116 Ashley Hill Dr
- 123 Spalding Cir
- 102 Paige Ct
- 125 Spalding Cir
- 134 Spalding Cir
- 104 Paige Ct
- 132 Spalding Cir
- 101 Paige Ct
- 130 Spalding Cir
- 117 Spalding Cir
- 129 Spalding Cir
- 128 Spalding Cir
- 103 Paige Ct
- 136 Spalding Cir
- 140 Spalding Cir
- 142 Spalding Cir
- 115 Spalding Cir
- 126 Spalding Cir
- 17 Spalding Cir
- 26 Spalding Cir Unit LOT
- 8 Spalding Cir