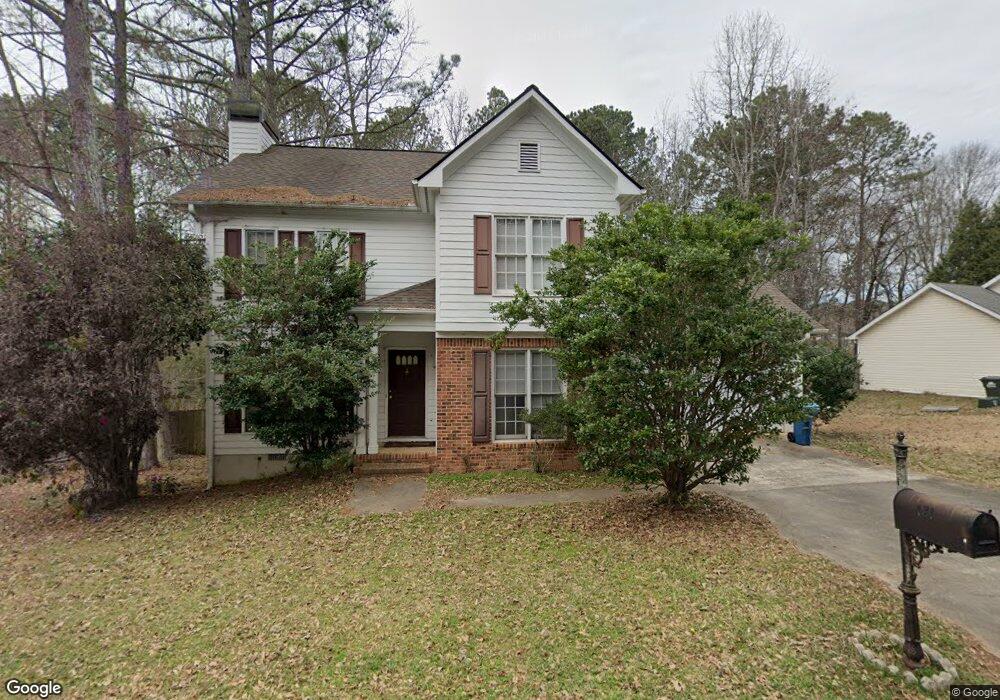
121 Spring Lake Dr Athens, GA 30605
Cedar Creek NeighborhoodEstimated Value: $317,510 - $331,000
3
Beds
3
Baths
1,703
Sq Ft
$190/Sq Ft
Est. Value
About This Home
This home is located at 121 Spring Lake Dr, Athens, GA 30605 and is currently estimated at $322,878, approximately $189 per square foot. 121 Spring Lake Dr is a home located in Clarke County with nearby schools including Hilsman Middle School, Cedar Shoals High School, and Athens Montessori School.
Ownership History
Date
Name
Owned For
Owner Type
Purchase Details
Closed on
Dec 15, 2005
Sold by
Lewis Annette
Bought by
Smith Thomas Lavon
Current Estimated Value
Home Financials for this Owner
Home Financials are based on the most recent Mortgage that was taken out on this home.
Original Mortgage
$133,200
Outstanding Balance
$74,049
Interest Rate
6.28%
Mortgage Type
New Conventional
Estimated Equity
$248,829
Purchase Details
Closed on
Aug 27, 2003
Sold by
Kane Kimberly Longmire
Bought by
Lewis Annette
Purchase Details
Closed on
Jun 6, 1998
Sold by
Kane Kimberly L and Kane Casey P
Bought by
Kane Kimberly Longmire
Purchase Details
Closed on
Nov 14, 1997
Sold by
First South Homes Inc
Bought by
Kane Kimberly L and Kane Casey P
Purchase Details
Closed on
May 6, 1996
Sold by
Springlake L P
Bought by
First South Homes Inc
Purchase Details
Closed on
Sep 4, 1995
Sold by
Broun Conway C
Bought by
Springlake L P
Create a Home Valuation Report for This Property
The Home Valuation Report is an in-depth analysis detailing your home's value as well as a comparison with similar homes in the area
Home Values in the Area
Average Home Value in this Area
Purchase History
| Date | Buyer | Sale Price | Title Company |
|---|---|---|---|
| Smith Thomas Lavon | $148,000 | -- | |
| Lewis Annette | $141,000 | -- | |
| Kane Kimberly Longmire | -- | -- | |
| Kane Kimberly L | $120,200 | -- | |
| First South Homes Inc | $18,500 | -- | |
| Springlake L P | -- | -- |
Source: Public Records
Mortgage History
| Date | Status | Borrower | Loan Amount |
|---|---|---|---|
| Open | Smith Thomas Lavon | $133,200 |
Source: Public Records
Tax History Compared to Growth
Tax History
| Year | Tax Paid | Tax Assessment Tax Assessment Total Assessment is a certain percentage of the fair market value that is determined by local assessors to be the total taxable value of land and additions on the property. | Land | Improvement |
|---|---|---|---|---|
| 2025 | $2,186 | $114,693 | $12,000 | $102,693 |
| 2024 | $2,186 | $110,284 | $12,000 | $98,284 |
| 2023 | $1,116 | $102,727 | $10,400 | $92,327 |
| 2022 | $2,175 | $88,889 | $10,400 | $78,489 |
| 2021 | $2,047 | $70,727 | $10,400 | $60,327 |
| 2020 | $1,921 | $66,991 | $10,400 | $56,591 |
| 2019 | $1,708 | $60,322 | $10,400 | $49,922 |
| 2018 | $1,569 | $56,213 | $10,400 | $45,813 |
| 2017 | $1,460 | $52,997 | $10,400 | $42,597 |
| 2016 | $1,373 | $50,455 | $10,400 | $40,055 |
| 2015 | $1,349 | $49,656 | $10,400 | $39,256 |
| 2014 | $1,375 | $50,359 | $10,400 | $39,959 |
Source: Public Records
Map
Nearby Homes
- 119 Spring Lake Dr
- 255 Cedar Creek Dr
- 169 Spring Lake Dr
- 125 Saint Andrews Ct
- 125 Broomsedge Trail
- 200 Scandia Cir Unit 5
- 1283 Cedar Shoals Dr
- 450 Gaines School Rd
- 400 Greencrest Dr
- 354 Greencrest Dr
- 352 Greencrest Dr
- 100 Ansonborough Ln Unit 403
- 100 Ansonborough Ln Unit 601
- 245 Cedar Springs Dr
- 219 Georgetown Dr
- 430 Forest Rd
- 125 Spring Lake Dr
- 125 Spring Lake Dr
- 132 Spring Lake Dr
- 115 Spring Lake Dr
- 115 Vintage Ct
- 111 Vintage Ct
- 107 Vintage Ct
- 131 Spring Lake Dr
- 113 Spring Lake Dr
- 134 Spring Lake Dr
- 119 Vintage Ct Unit 121
- 119 Vintage Ct
- 160-162 Pace Dr W
- 121 Vintage Ct
- 160 W Paces Dr
- 120 Spring Lake Dr
- Lot 1 B Spring Lake Dr
- 111 Spring Lake Dr
- 135 Spring Lake Dr