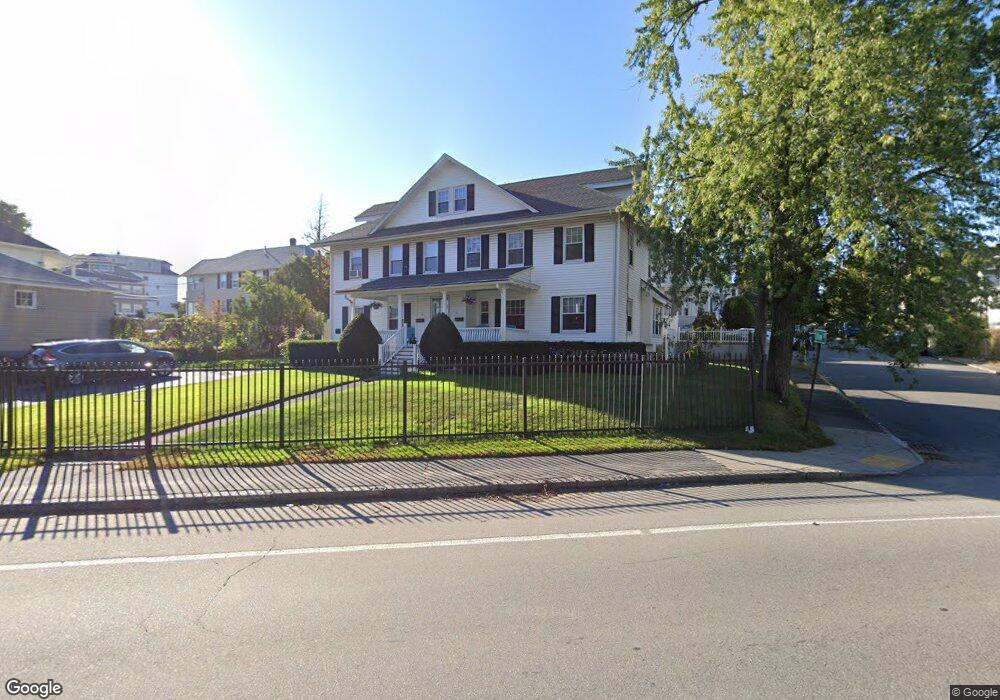
121 Swan St Unit 123 Methuen, MA 01844
The East End NeighborhoodEstimated Value: $648,000 - $791,000
8
Beds
2
Baths
2,652
Sq Ft
$272/Sq Ft
Est. Value
About This Home
This home is located at 121 Swan St Unit 123, Methuen, MA 01844 and is currently estimated at $720,641, approximately $271 per square foot. 121 Swan St Unit 123 is a home located in Essex County with nearby schools including Timony Grammar School, South Point Elementary School, and Methuen High School.
Ownership History
Date
Name
Owned For
Owner Type
Purchase Details
Closed on
Nov 25, 2015
Sold by
Quispe Constantino C and Quispe Luzmila M
Bought by
Quispe Constantino C and Quispe Luzmila M
Current Estimated Value
Home Financials for this Owner
Home Financials are based on the most recent Mortgage that was taken out on this home.
Original Mortgage
$257,000
Outstanding Balance
$202,136
Interest Rate
3.87%
Mortgage Type
New Conventional
Estimated Equity
$518,505
Purchase Details
Closed on
Aug 14, 1998
Sold by
Ranieri Mario A
Bought by
Quispe Constantino
Purchase Details
Closed on
Oct 18, 1994
Sold by
Close Maurice
Bought by
Ranieri Mario A
Create a Home Valuation Report for This Property
The Home Valuation Report is an in-depth analysis detailing your home's value as well as a comparison with similar homes in the area
Home Values in the Area
Average Home Value in this Area
Purchase History
| Date | Buyer | Sale Price | Title Company |
|---|---|---|---|
| Quispe Constantino C | -- | -- | |
| Quispe Constantino C | -- | -- | |
| Quispe Constantino C | -- | -- | |
| Quispe Constantino | $145,000 | -- | |
| Quispe Constantino | $145,000 | -- | |
| Ranieri Mario A | $100,500 | -- | |
| Ranieri Mario A | $100,500 | -- |
Source: Public Records
Mortgage History
| Date | Status | Borrower | Loan Amount |
|---|---|---|---|
| Open | Quispe Constantino C | $257,000 | |
| Closed | Quispe Constantino C | $257,000 | |
| Previous Owner | Ranieri Mario A | $130,000 |
Source: Public Records
Tax History Compared to Growth
Tax History
| Year | Tax Paid | Tax Assessment Tax Assessment Total Assessment is a certain percentage of the fair market value that is determined by local assessors to be the total taxable value of land and additions on the property. | Land | Improvement |
|---|---|---|---|---|
| 2025 | $7,182 | $678,800 | $181,500 | $497,300 |
| 2024 | $6,540 | $602,200 | $165,000 | $437,200 |
| 2023 | $6,073 | $519,100 | $144,300 | $374,800 |
| 2022 | $5,610 | $429,900 | $123,700 | $306,200 |
| 2021 | $5,354 | $405,900 | $116,900 | $289,000 |
| 2020 | $4,994 | $371,600 | $116,900 | $254,700 |
| 2019 | $4,898 | $345,200 | $110,000 | $235,200 |
| 2018 | $4,438 | $311,000 | $103,100 | $207,900 |
| 2017 | $4,228 | $288,600 | $96,200 | $192,400 |
| 2016 | $3,954 | $267,000 | $89,400 | $177,600 |
| 2015 | $3,551 | $243,200 | $74,200 | $169,000 |
Source: Public Records
Map
Nearby Homes
- 24 Court St
- 15 Swan Ave
- 24 Boylston St
- 35 Swan Ave
- 9 Boylston St
- 20 Knox St Unit 43
- 20 Knox St Unit 23
- 63 Lippold St
- 35 Kendall St
- 6 Longwood Dr
- 167 Ferry 53 Mann St Unit 2,5,6
- 4 Alderbrook Ln
- 68 Wesley St
- 5 Harmony Ln
- 29 Meadowbrook Rd
- 7 Magnolia Rd
- 106 Leroy Ave
- 100-102 E Haverhill St
- 37 Albion St
- 169 Berkeley St
- 21 Olive St Unit 23
- 21-23 Olive St
- 46 Vermont St Unit 48
- 17-19 Olive St
- 17-19 Olive St Unit 2
- 19 Olive St Unit 2
- 17 Olive St Unit 19
- 125 Swan St
- 38 Vermont St Unit 40
- 117 Swan St Unit 119
- 117 Swan St Unit 2
- 117 Swan St Unit 1
- 13-15 Olive St
- 106 Swan St
- 104 Swan St
- 13 Olive St Unit 15
- 34-36 Vermont St
- 34 Vermont St Unit 36
- 12 Olive St
- 100 Swan St Unit 102