Estimated Value: $596,000 - $650,000
3
Beds
3
Baths
3,058
Sq Ft
$203/Sq Ft
Est. Value
About This Home
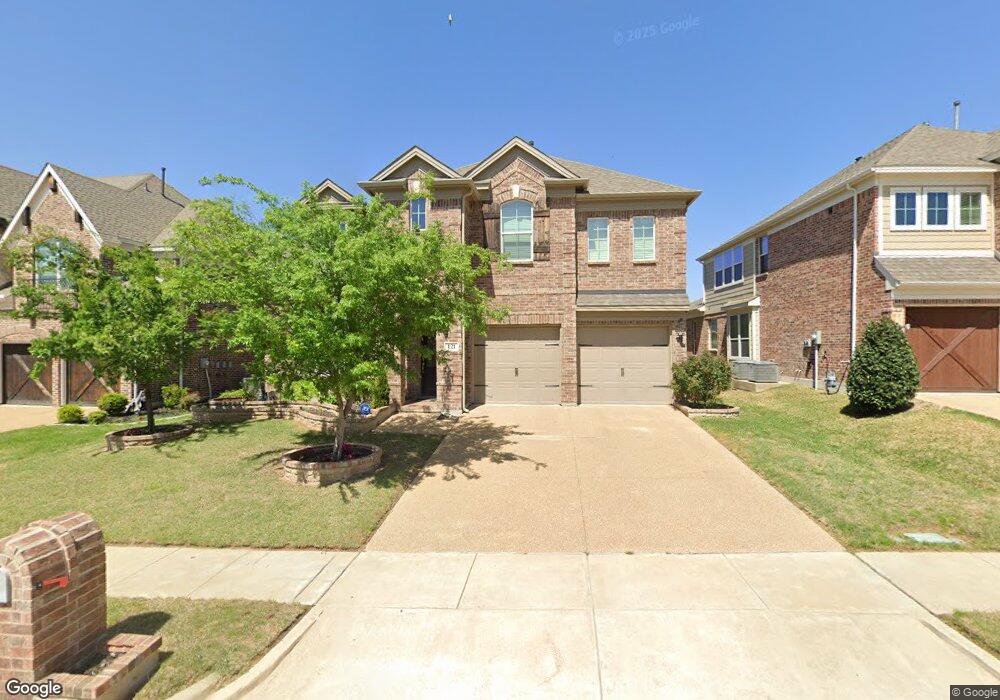
This home is located at 121 Turks Cap Trail, Wylie, TX 75098 and is currently estimated at $619,510, approximately $202 per square foot. 121 Turks Cap Trail is a home located in Collin County with nearby schools including Wally Watkins Elementary School, AB Harrison Intermediate School, and Grady Burnett J High School.
Ownership History
Date
Name
Owned For
Owner Type
Purchase Details
Closed on
Jul 10, 2020
Sold by
Baker Alphonso and Jones Lawrence Donnell
Bought by
Silva Alexander Da and Newson Alina
Current Estimated Value
Home Financials for this Owner
Home Financials are based on the most recent Mortgage that was taken out on this home.
Original Mortgage
$408,500
Outstanding Balance
$362,231
Interest Rate
3.1%
Mortgage Type
New Conventional
Estimated Equity
$257,279
Purchase Details
Closed on
Jul 31, 2017
Sold by
Grand Homes 2014 L P Texas Limited Part
Bought by
Baker Alphonso and Jones Lawrence Donell
Home Financials for this Owner
Home Financials are based on the most recent Mortgage that was taken out on this home.
Original Mortgage
$358,056
Interest Rate
4.12%
Mortgage Type
FHA
Purchase Details
Closed on
Mar 18, 2016
Sold by
Wylie Dpv Limited Partnership
Bought by
Grand Homes 2014 Lp
Create a Home Valuation Report for This Property
The Home Valuation Report is an in-depth analysis detailing your home's value as well as a comparison with similar homes in the area
Home Values in the Area
Average Home Value in this Area
Purchase History
| Date | Buyer | Sale Price | Title Company |
|---|---|---|---|
| Silva Alexander Da | -- | Members Title Llc | |
| Baker Alphonso | -- | Chicago Title | |
| Grand Homes 2014 Lp | -- | None Available |
Source: Public Records
Mortgage History
| Date | Status | Borrower | Loan Amount |
|---|---|---|---|
| Open | Silva Alexander Da | $408,500 | |
| Previous Owner | Baker Alphonso | $358,056 |
Source: Public Records
Tax History Compared to Growth
Tax History
| Year | Tax Paid | Tax Assessment Tax Assessment Total Assessment is a certain percentage of the fair market value that is determined by local assessors to be the total taxable value of land and additions on the property. | Land | Improvement |
|---|---|---|---|---|
| 2025 | $9,527 | $606,439 | $140,000 | $486,022 |
| 2024 | $9,527 | $551,308 | $140,000 | $499,700 |
| 2023 | $9,527 | $501,189 | $140,000 | $479,491 |
| 2022 | $9,996 | $455,626 | $120,000 | $417,536 |
| 2021 | $9,746 | $414,205 | $90,000 | $324,205 |
| 2020 | $5,132 | $206,675 | $45,000 | $161,675 |
| 2019 | $10,410 | $396,141 | $90,000 | $306,141 |
| 2018 | $10,698 | $397,228 | $90,000 | $307,228 |
| 2017 | $1,549 | $57,500 | $57,500 | $0 |
| 2016 | $1,600 | $57,600 | $57,600 | $0 |
Source: Public Records
Map
Nearby Homes
- 100 Lavender Ln
- 221 Red Bud Pass
- Grand Lantana Plan at Dominion of Pleasant Valley
- Lake Forest - 3 Car Garage Plan at Dominion of Pleasant Valley
- Hartford II Plan at Dominion of Pleasant Valley
- Grand Whitehall - 3 Car Garage Plan at Dominion of Pleasant Valley
- Brandonwood Plan at Dominion of Pleasant Valley
- Lake Forest Plan at Dominion of Pleasant Valley
- Grand Monterra II Plan at Dominion of Pleasant Valley
- Downton Abbey Plan at Dominion of Pleasant Valley
- Grand Riverside Plan at Dominion of Pleasant Valley
- Hartford Plan at Dominion of Pleasant Valley
- Grand Lantana - 3 Car Garage Plan at Dominion of Pleasant Valley
- Downton Abbey - 3 Car Garage Plan at Dominion of Pleasant Valley
- Grand Whitehall Plan at Dominion of Pleasant Valley
- Grand Monterra Plan at Dominion of Pleasant Valley
- Grand Signature Plan at Dominion of Pleasant Valley
- Grand Silverwood Plan at Dominion of Pleasant Valley
- Hartford - 3 Car Garage Plan at Dominion of Pleasant Valley
- Grand South Pointe Plan at Dominion of Pleasant Valley
- 123 Turks Cap Trail
- 119 Turks Cap Trail
- 117 Turk's Cap Trail
- 125 Turks Cap Trail
- 125 Turk's Cap Trail
- 117 Turks Cap Trail
- 118 Live Oak Dr
- 120 Live Oak Dr
- 116 Live Oak Dr
- 122 Live Oak Dr
- 127 Turks Cap Trail
- 115 Turk's Cap Trail
- 122 Turks Cap Trail
- 120 Turks Cap Trail
- 124 Turks Cap Trail
- 114 Live Oak Dr
- 118 Turks Cap Trail
- 124 Live Oak Dr
- 126 Turks Cap Trail
- 129 Turks Cap Trail