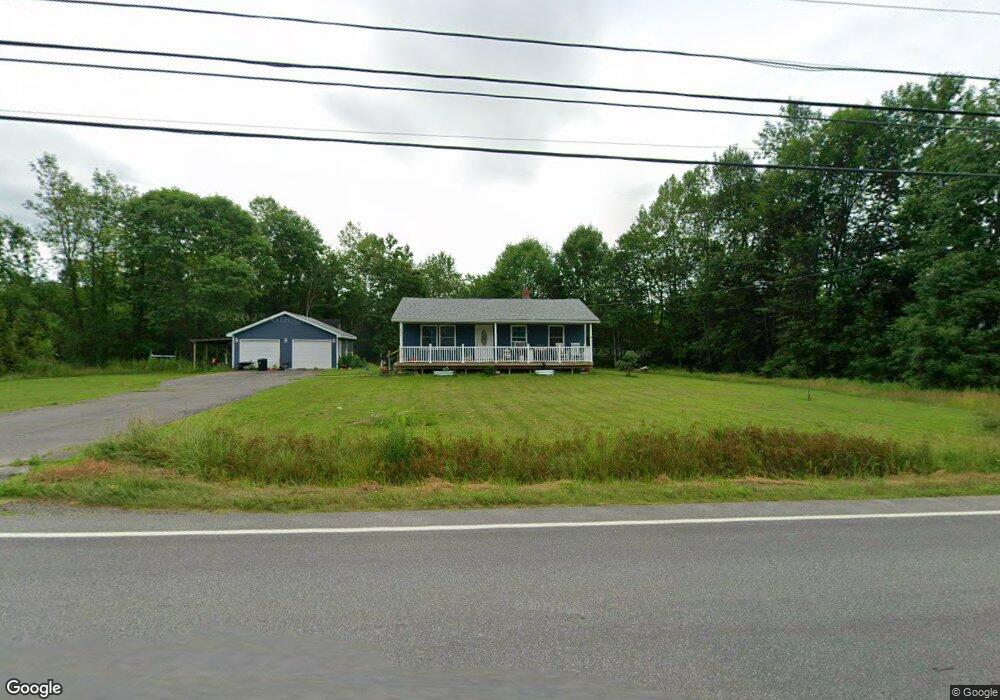
121 Unity Rd Benton, ME 04901
Estimated Value: $222,866 - $328,000
2
Beds
1
Bath
900
Sq Ft
$291/Sq Ft
Est. Value
About This Home
This home is located at 121 Unity Rd, Benton, ME 04901 and is currently estimated at $261,717, approximately $290 per square foot. 121 Unity Rd is a home located in Kennebec County with nearby schools including Lawrence High School and Kennebec Montessori School.
Ownership History
Date
Name
Owned For
Owner Type
Purchase Details
Closed on
Aug 30, 2023
Sold by
Dangelo Christopher and Robbins Lacey
Bought by
Robbins Lacey
Current Estimated Value
Home Financials for this Owner
Home Financials are based on the most recent Mortgage that was taken out on this home.
Original Mortgage
$190,781
Interest Rate
7.12%
Mortgage Type
FHA
Purchase Details
Closed on
Jan 31, 2019
Sold by
Ez Living Llc
Bought by
Robbins Lacey and Dangelo Christopher
Home Financials for this Owner
Home Financials are based on the most recent Mortgage that was taken out on this home.
Original Mortgage
$152,192
Interest Rate
4.6%
Mortgage Type
FHA
Create a Home Valuation Report for This Property
The Home Valuation Report is an in-depth analysis detailing your home's value as well as a comparison with similar homes in the area
Home Values in the Area
Average Home Value in this Area
Purchase History
| Date | Buyer | Sale Price | Title Company |
|---|---|---|---|
| Robbins Lacey | -- | Advantage Title | |
| Robbins Lacey | -- | -- |
Source: Public Records
Mortgage History
| Date | Status | Borrower | Loan Amount |
|---|---|---|---|
| Previous Owner | Robbins Lacey | $190,781 | |
| Previous Owner | Robbins Lacey | $152,192 |
Source: Public Records
Tax History
| Year | Tax Paid | Tax Assessment Tax Assessment Total Assessment is a certain percentage of the fair market value that is determined by local assessors to be the total taxable value of land and additions on the property. | Land | Improvement |
|---|---|---|---|---|
| 2025 | $2,313 | $165,210 | $37,250 | $127,960 |
| 2024 | $2,396 | $165,210 | $37,250 | $127,960 |
| 2023 | $2,131 | $165,210 | $37,250 | $127,960 |
| 2022 | $2,148 | $165,210 | $37,250 | $127,960 |
| 2021 | $1,944 | $109,210 | $22,500 | $86,710 |
| 2020 | $1,715 | $109,210 | $22,500 | $86,710 |
| 2019 | $514 | $34,060 | $22,500 | $11,560 |
| 2018 | $497 | $34,060 | $22,500 | $11,560 |
| 2017 | $1,236 | $85,850 | $25,000 | $60,850 |
| 2016 | $1,176 | $85,850 | $25,000 | $60,850 |
| 2015 | $1,159 | $85,850 | $25,000 | $60,850 |
| 2014 | $1,168 | $85,850 | $25,000 | $60,850 |
| 2013 | $1,125 | $85,850 | $25,000 | $60,850 |
Source: Public Records
Map
Nearby Homes
Your Personal Tour Guide
Ask me questions while you tour the home.