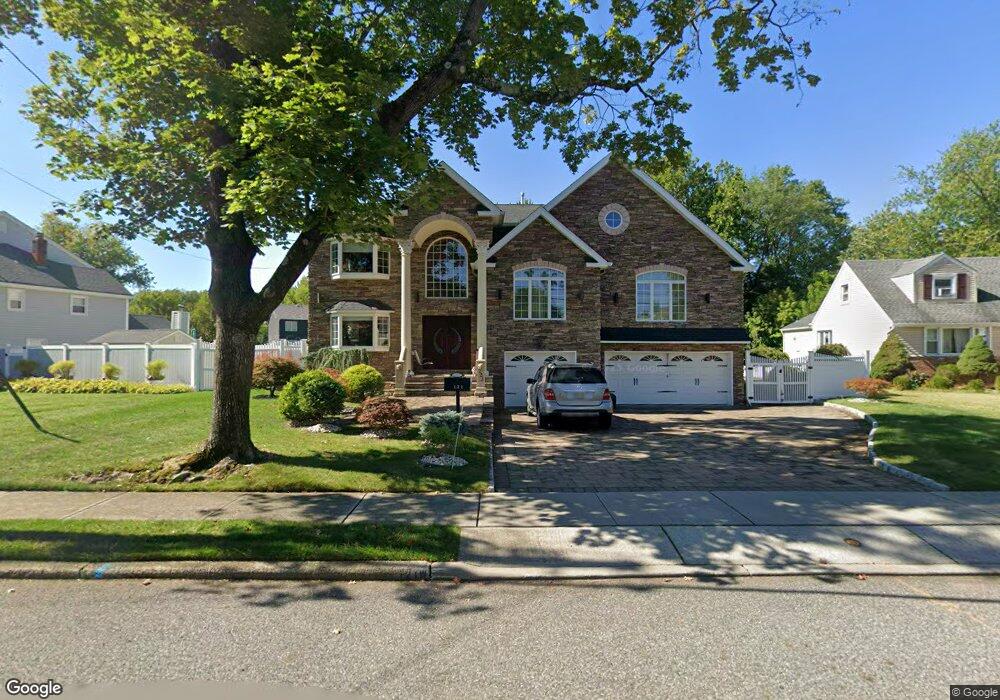
121 Village Cir W Paramus, NJ 07652
Estimated Value: $1,486,000 - $1,743,000
--
Bed
--
Bath
3,423
Sq Ft
$459/Sq Ft
Est. Value
About This Home
This home is located at 121 Village Cir W, Paramus, NJ 07652 and is currently estimated at $1,572,140, approximately $459 per square foot. 121 Village Cir W is a home located in Bergen County with nearby schools including Paramus High School, Ben Porat Yosef, and St. Peter Academy.
Ownership History
Date
Name
Owned For
Owner Type
Purchase Details
Closed on
Jun 15, 2011
Sold by
Cockefair James A and Cockefair Dorothy A
Bought by
Menon Gopalkrishna G
Current Estimated Value
Home Financials for this Owner
Home Financials are based on the most recent Mortgage that was taken out on this home.
Original Mortgage
$481,770
Outstanding Balance
$32,048
Interest Rate
4.25%
Mortgage Type
FHA
Estimated Equity
$1,540,092
Create a Home Valuation Report for This Property
The Home Valuation Report is an in-depth analysis detailing your home's value as well as a comparison with similar homes in the area
Home Values in the Area
Average Home Value in this Area
Purchase History
| Date | Buyer | Sale Price | Title Company |
|---|---|---|---|
| Menon Gopalkrishna G | $530,000 | -- |
Source: Public Records
Mortgage History
| Date | Status | Borrower | Loan Amount |
|---|---|---|---|
| Open | Menon Gopalkrishna G | $481,770 |
Source: Public Records
Tax History Compared to Growth
Tax History
| Year | Tax Paid | Tax Assessment Tax Assessment Total Assessment is a certain percentage of the fair market value that is determined by local assessors to be the total taxable value of land and additions on the property. | Land | Improvement |
|---|---|---|---|---|
| 2025 | $18,014 | $1,261,300 | $382,600 | $878,700 |
| 2024 | $17,500 | $1,189,800 | $354,600 | $835,200 |
| 2023 | $16,513 | $1,140,800 | $336,800 | $804,000 |
| 2022 | $16,513 | $1,064,000 | $315,200 | $748,800 |
| 2021 | $16,191 | $978,900 | $289,700 | $689,200 |
| 2020 | $15,148 | $949,700 | $269,700 | $680,000 |
| 2019 | $15,477 | $833,900 | $242,000 | $591,900 |
| 2018 | $15,285 | $833,900 | $242,000 | $591,900 |
| 2017 | $7,960 | $442,000 | $242,000 | $200,000 |
| 2016 | $7,117 | $406,200 | $242,000 | $164,200 |
| 2015 | $7,044 | $406,200 | $242,000 | $164,200 |
| 2014 | $6,983 | $406,200 | $242,000 | $164,200 |
Source: Public Records
Map
Nearby Homes
- 122 Village Cir E
- 150 Village Cir E
- 189 Forest Ave Unit 409
- 189 Forest Ave Unit 303
- 1 Sipporta Ln
- 56 Lilac Ln
- 187 Crest Dr
- 171 Brookfield Ave
- 29 Millar Ct
- 104 Trinity Ct
- 4 Schubert Ln
- 6 Schubert Ln
- 327 van Saun Dr
- 302 Howland Ave
- 42 Eastbrook Dr
- 16 Coles Ct
- 165 Hebberd Ave
- 215 Kensington Rd
- 146 Lawrence Dr
- 162 Split Rock Rd
- 123 Village Cir W
- 117 Village Cir W
- 115 Village Cir W
- 181 Howland Ave
- 177 Howland Ave
- 125 Village Cir W
- 124 Village Cir W
- 122 Village Cir W
- 111 Village Cir W
- 123 Village Cir E
- 114 Ramille Ct
- 110 Ramille Ct
- 128 Village Cir W
- 127 Village Cir W
- 114 Village Cir E
- 173 Howland Ave
- 191 Howland Ave
- 118 Village Cir E
- 91 Andrea Ct
- 195 Howland Ave