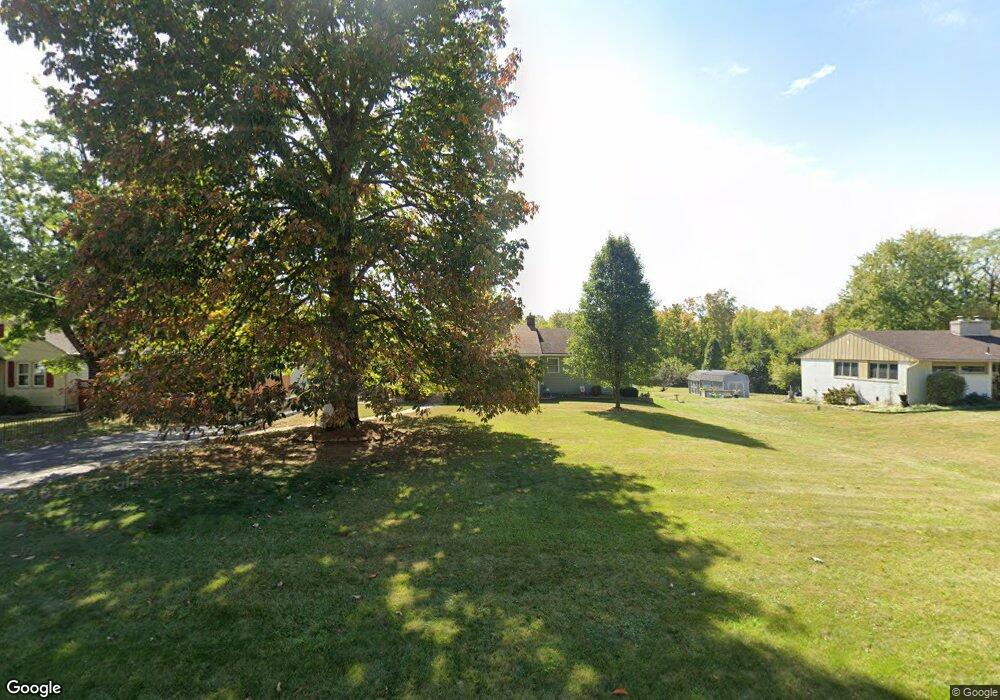
121 W Possum Rd Springfield, OH 45506
Estimated Value: $201,000 - $284,623
2
Beds
2
Baths
1,439
Sq Ft
$179/Sq Ft
Est. Value
About This Home
This home is located at 121 W Possum Rd, Springfield, OH 45506 and is currently estimated at $258,156, approximately $179 per square foot. 121 W Possum Rd is a home located in Clark County with nearby schools including Shawnee Middle School/High School and Risen Christ Lutheran School.
Ownership History
Date
Name
Owned For
Owner Type
Purchase Details
Closed on
Nov 5, 2009
Sold by
Aurora Loan Services Llc
Bought by
Gallmeyer Kurt D and Gallmeyer Tammy S
Current Estimated Value
Home Financials for this Owner
Home Financials are based on the most recent Mortgage that was taken out on this home.
Original Mortgage
$76,000
Outstanding Balance
$49,498
Interest Rate
4.95%
Mortgage Type
New Conventional
Estimated Equity
$208,658
Purchase Details
Closed on
Jun 8, 2009
Sold by
Sweet Thomas T and Case #07-Cv 0529
Bought by
Aurora Loan Services Llc
Purchase Details
Closed on
Dec 27, 1999
Sold by
Ervin Family Trust
Bought by
Sweet Thomas T
Home Financials for this Owner
Home Financials are based on the most recent Mortgage that was taken out on this home.
Original Mortgage
$87,550
Interest Rate
8%
Mortgage Type
VA
Purchase Details
Closed on
Jan 23, 1992
Create a Home Valuation Report for This Property
The Home Valuation Report is an in-depth analysis detailing your home's value as well as a comparison with similar homes in the area
Home Values in the Area
Average Home Value in this Area
Purchase History
| Date | Buyer | Sale Price | Title Company |
|---|---|---|---|
| Gallmeyer Kurt D | $96,000 | Nova Title Agency Inc | |
| Aurora Loan Services Llc | $90,000 | None Available | |
| Sweet Thomas T | $85,000 | -- | |
| -- | -- | -- |
Source: Public Records
Mortgage History
| Date | Status | Borrower | Loan Amount |
|---|---|---|---|
| Open | Gallmeyer Kurt D | $76,000 | |
| Previous Owner | Sweet Thomas T | $87,550 |
Source: Public Records
Tax History Compared to Growth
Tax History
| Year | Tax Paid | Tax Assessment Tax Assessment Total Assessment is a certain percentage of the fair market value that is determined by local assessors to be the total taxable value of land and additions on the property. | Land | Improvement |
|---|---|---|---|---|
| 2024 | $3,346 | $68,320 | $17,430 | $50,890 |
| 2023 | $3,346 | $68,320 | $17,430 | $50,890 |
| 2022 | $3,318 | $68,320 | $17,430 | $50,890 |
| 2021 | $2,988 | $54,960 | $13,210 | $41,750 |
| 2020 | $3,013 | $54,960 | $13,210 | $41,750 |
| 2019 | $3,060 | $54,960 | $13,210 | $41,750 |
| 2018 | $2,747 | $48,640 | $16,020 | $32,620 |
| 2017 | $2,815 | $45,550 | $16,020 | $29,530 |
| 2016 | $2,541 | $45,550 | $16,020 | $29,530 |
| 2015 | $2,377 | $44,213 | $15,404 | $28,809 |
| 2014 | $2,384 | $44,213 | $15,404 | $28,809 |
| 2013 | $2,073 | $44,213 | $15,404 | $28,809 |
Source: Public Records
Map
Nearby Homes
- 2855 Springfield Jamestown Rd
- 645 Dorchester Dr
- 703 Dorchester Dr
- 201 Kinnane Ave
- 758 Oneida Dr
- 421 Lyle Ave
- 3131 Springfield Xenia Rd
- 711 Kinnane Ave
- 2642 Springfield Xenia Rd
- 2707 Springfield Xenia Rd
- 341 W Leffel Ln
- 3142 Old Clifton Rd
- 4742 Peacock Rd
- 2064 Fairfield Pike
- 208 Corlington Dr
- 1421 Seminole Ave
- 2224 Duquesne Dr
- 1730 Damascus Ave
- 1820 Clay St
- 1754 S Fountain Ave
- 115 W Possum Rd
- 125 W Possum Rd
- 111 W Possum Rd
- 81 W Possum Rd
- 135 W Possum Rd
- 132 W Possum Rd
- 70 W Possum Rd
- 134 W Possum Rd
- 75 W Possum Rd
- 130 W Possum Rd
- 64 W Possum Rd
- 145 W Possum Rd
- 72 W Possum Rd
- 140 W Possum Rd
- 60 W Possum Rd
- 155 W Possum Rd
- 65 W Possum Rd
- 3469 Hedgely Rd
- 146 W Possum Rd
- 161 W Possum Rd