121 Wait St Springfield, MA 01104
Liberty Heights NeighborhoodEstimated payment $1,969/month
Highlights
- Above Ground Pool
- Colonial Architecture
- Property is near public transit and schools
- Open Floorplan
- Deck
- Wood Flooring
About This Home
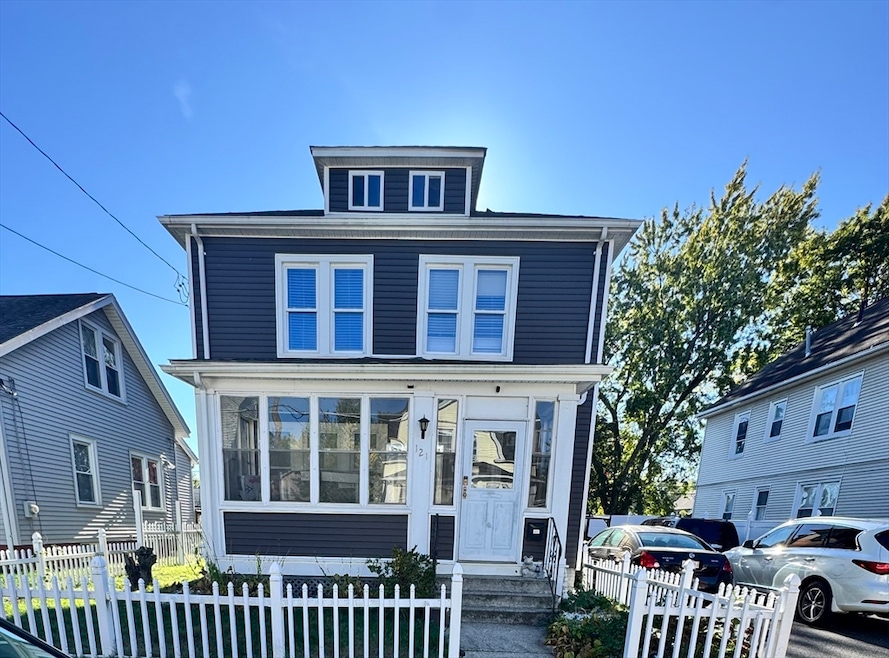
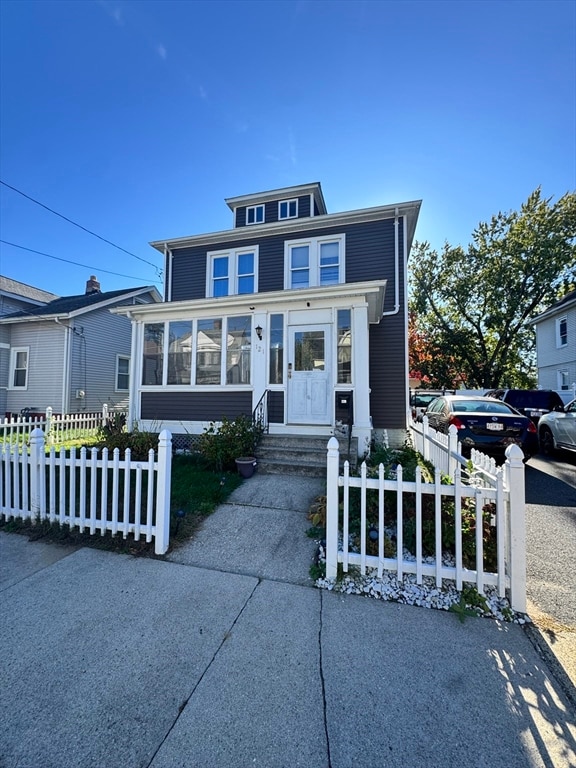
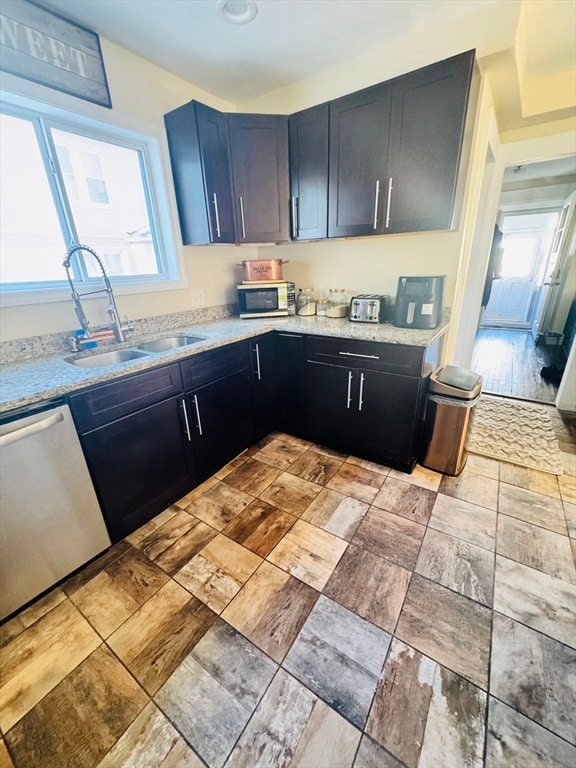
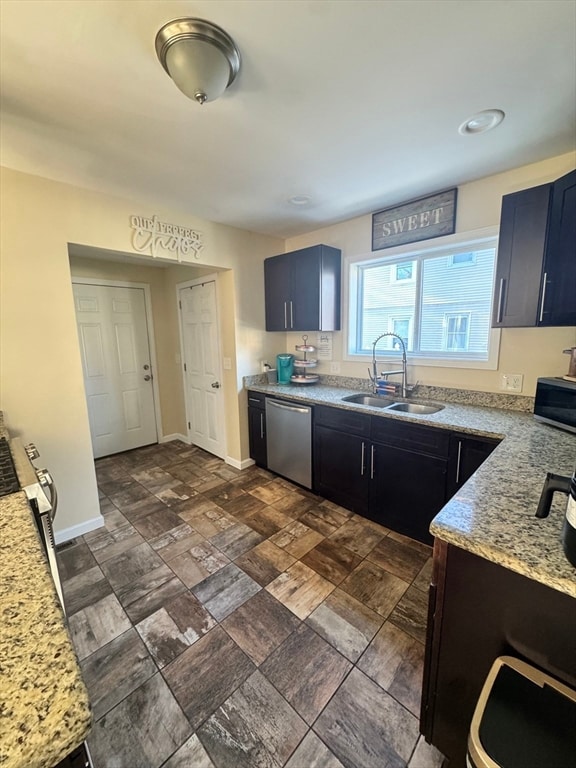
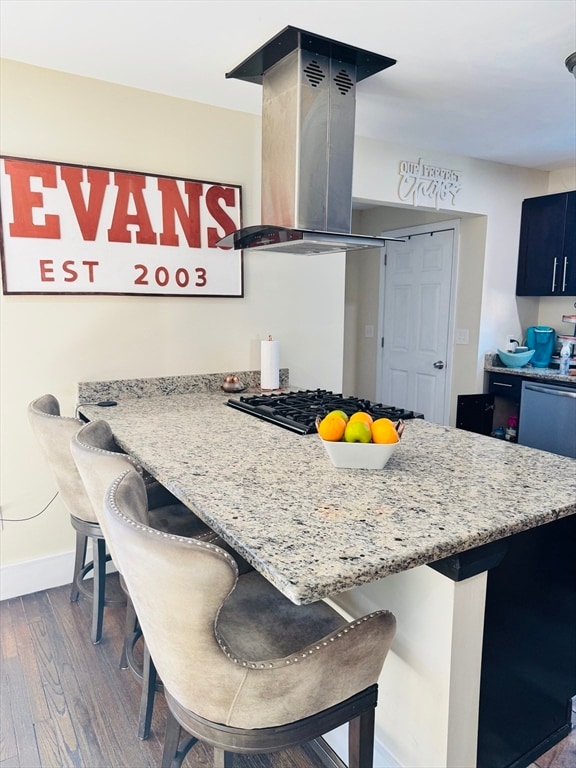
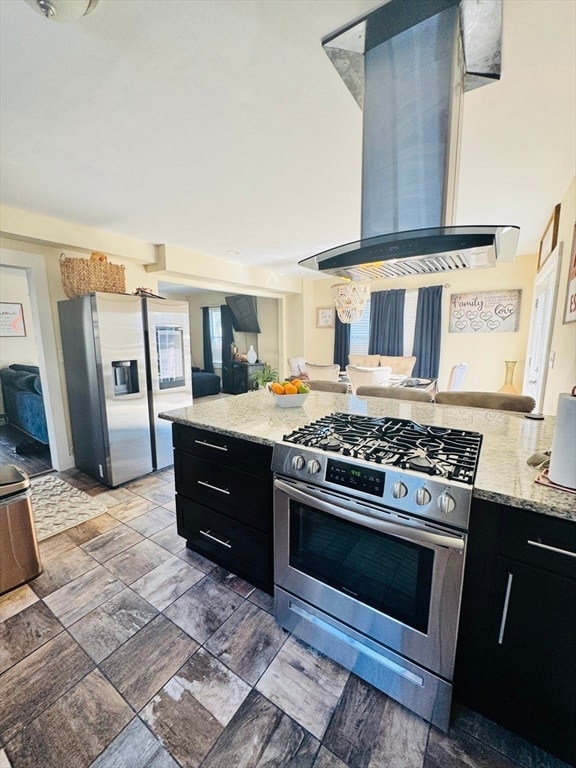
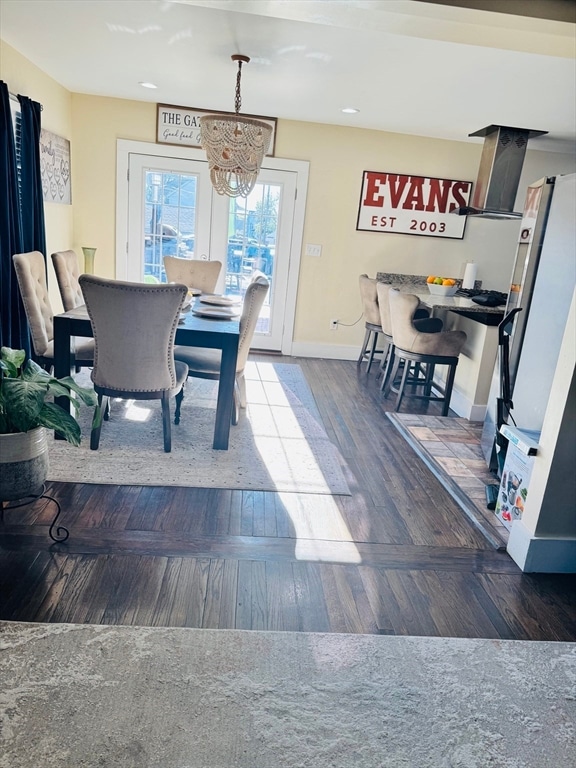
Beautifully maintained colonial with modern updates throughout! This 3-bedroom, 2.5-bath home offers a perfect blend of charm and functionality. The first floor features an updated kitchen with granite countertops, breakfast bar, stainless-steel appliances, and a sleek range hood. The open layout flows into the dining and living areas with hardwood floors and plenty of natural light, ideal for entertaining or everyday living.The finished basement provides additional living space, perfect for a family room, home office, or gym, with a full bathroom. Upstairs, the spacious bedrooms offer ample closet space, and an updated bathroom with modern finishes. Enjoy outdoor living on the large deck, great for grilling, relaxing, entertaining, or take a dip in the above ground pool located in the fenced back yard.This home has major updates including, electrical, central air, forced-air heat, a tankless water heater for year-round comfort, vinyl siding and a new roof, approximately 6 years old.
Home Details
Home Type
- Single Family
Est. Annual Taxes
- $3,864
Year Built
- Built in 1925 | Remodeled
Lot Details
- 5,519 Sq Ft Lot
- Fenced
- Property is zoned R2
Home Design
- Colonial Architecture
- Block Foundation
Interior Spaces
- 1,182 Sq Ft Home
- Open Floorplan
- Recessed Lighting
- French Doors
Kitchen
- Range with Range Hood
- Dishwasher
- Stainless Steel Appliances
- Solid Surface Countertops
Flooring
- Wood
- Ceramic Tile
- Vinyl
Bedrooms and Bathrooms
- 3 Bedrooms
- Primary bedroom located on second floor
- Walk-In Closet
Finished Basement
- Basement Fills Entire Space Under The House
- Laundry in Basement
Parking
- 6 Car Parking Spaces
- Driveway
- Paved Parking
- 6 Open Parking Spaces
- Off-Street Parking
Outdoor Features
- Above Ground Pool
- Deck
- Enclosed Patio or Porch
Location
- Property is near public transit and schools
Utilities
- Forced Air Heating and Cooling System
- Heating System Uses Natural Gas
- 110 Volts
- Tankless Water Heater
- Gas Water Heater
Listing and Financial Details
- Assessor Parcel Number S:11915 P:0033,2610416
Community Details
Overview
- No Home Owners Association
Recreation
- Park
- Jogging Path
Map
Home Values in the Area
Average Home Value in this Area
Tax History
| Year | Tax Paid | Tax Assessment Tax Assessment Total Assessment is a certain percentage of the fair market value that is determined by local assessors to be the total taxable value of land and additions on the property. | Land | Improvement |
|---|---|---|---|---|
| 2025 | $3,864 | $246,400 | $37,900 | $208,500 |
| 2024 | $3,543 | $220,600 | $37,900 | $182,700 |
| 2023 | $3,586 | $210,300 | $33,500 | $176,800 |
| 2022 | $3,657 | $194,300 | $31,400 | $162,900 |
| 2021 | $3,283 | $173,700 | $28,500 | $145,200 |
| 2020 | $1,121 | $57,400 | $28,500 | $28,900 |
| 2019 | $2,657 | $135,000 | $23,600 | $111,400 |
| 2018 | $2,440 | $124,000 | $23,600 | $100,400 |
| 2017 | $2,353 | $119,700 | $25,100 | $94,600 |
| 2016 | $2,465 | $125,400 | $25,100 | $100,300 |
| 2015 | $2,337 | $118,800 | $25,100 | $93,700 |
Property History
| Date | Event | Price | List to Sale | Price per Sq Ft |
|---|---|---|---|---|
| 03/11/2026 03/11/26 | For Sale | $320,000 | 0.0% | $271 / Sq Ft |
| 02/18/2026 02/18/26 | Off Market | $320,000 | -- | -- |
| 01/06/2026 01/06/26 | Pending | -- | -- | -- |
| 12/27/2025 12/27/25 | For Sale | $320,000 | 0.0% | $271 / Sq Ft |
| 12/16/2025 12/16/25 | Off Market | $320,000 | -- | -- |
| 10/21/2025 10/21/25 | For Sale | $320,000 | -- | $271 / Sq Ft |
Purchase History
| Date | Type | Sale Price | Title Company |
|---|---|---|---|
| Deed | $120,000 | -- | |
| Deed | $81,500 | -- | |
| Deed | $94,000 | -- |
Mortgage History
| Date | Status | Loan Amount | Loan Type |
|---|---|---|---|
| Open | $120,000 | Purchase Money Mortgage | |
| Previous Owner | $85,640 | No Value Available | |
| Previous Owner | $80,833 | Purchase Money Mortgage | |
| Previous Owner | $96,590 | No Value Available |
Source: MLS Property Information Network (MLS PIN)
MLS Number: 73446176
APN: SPRI-011915-000000-000033
Disclaimer: Certain information contained herein is derived from information provided by parties other than Homes.com. All information provided is deemed reliable, but is not guaranteed to be accurate and should be independently verified.
![]() The property listing data and information, or the Images, set forth herein were provided to MLS Property Information Network, Inc. from third party sources, including sellers, lessors and public records, and were compiled by MLS Property Information Network, Inc. The property listing data and information, and the Images, are for the personal, non-commercial use of consumers having a good faith interest in purchasing or leasing listed properties of the type displayed to them and may not be used for any purpose other than to identify prospective properties which such consumers may have a good faith interest in purchasing or leasing. MLS Property Information Network, Inc. and its subscribers disclaim any and all representations and warranties as to the accuracy of the property listing data and information, or as to the accuracy of any of the Images, set forth herein.
The property listing data and information, or the Images, set forth herein were provided to MLS Property Information Network, Inc. from third party sources, including sellers, lessors and public records, and were compiled by MLS Property Information Network, Inc. The property listing data and information, and the Images, are for the personal, non-commercial use of consumers having a good faith interest in purchasing or leasing listed properties of the type displayed to them and may not be used for any purpose other than to identify prospective properties which such consumers may have a good faith interest in purchasing or leasing. MLS Property Information Network, Inc. and its subscribers disclaim any and all representations and warranties as to the accuracy of the property listing data and information, or as to the accuracy of any of the Images, set forth herein.
- 118 Wait St
- 744-746 Carew St
- 708-710 Carew St
- 774-776 Liberty St
- 103 Ontario St
- 491-493 Newbury St
- 571-573 Carew St
- 119 Littleton St
- 27 Parallel St
- 1078 Liberty St
- 151 Littleton St
- 9 Utica St
- 24 Melha Ave
- 211-213 Chapin Terrace
- 52 Vadnais St
- 150 Drexel St
- 59 Piedmont St
- 33 Drexel St
- 57 Narragansett St
- 49 Upland St
- 723 Carew St Unit 3
- 46-48 Wait St Unit 2
- 12-14 Kendall St Unit 2
- 739 Liberty St Unit 2nd Floor
- 46 Mooreland St Unit 46
- 46 Mooreland St Unit 1FL
- 383 Newbury St Unit 2nd
- 83 Silver St Unit 83 silver st springfield ma 01107
- 185 Middle St Unit 185
- 177 Springfield St
- 22 Crane St
- 68 Waverly St Unit 3
- 1592 Dwight St Unit 1st Floor
- 47 Grant St Unit Floor 1
- 47 Grant St
- 47 Dartmouth St
- 111 Bay St Unit 113
- 181 Chestnut St Unit 6
- 181 Chestnut St
- 314 Springfield St Unit 314

Ask me questions while you tour the home.