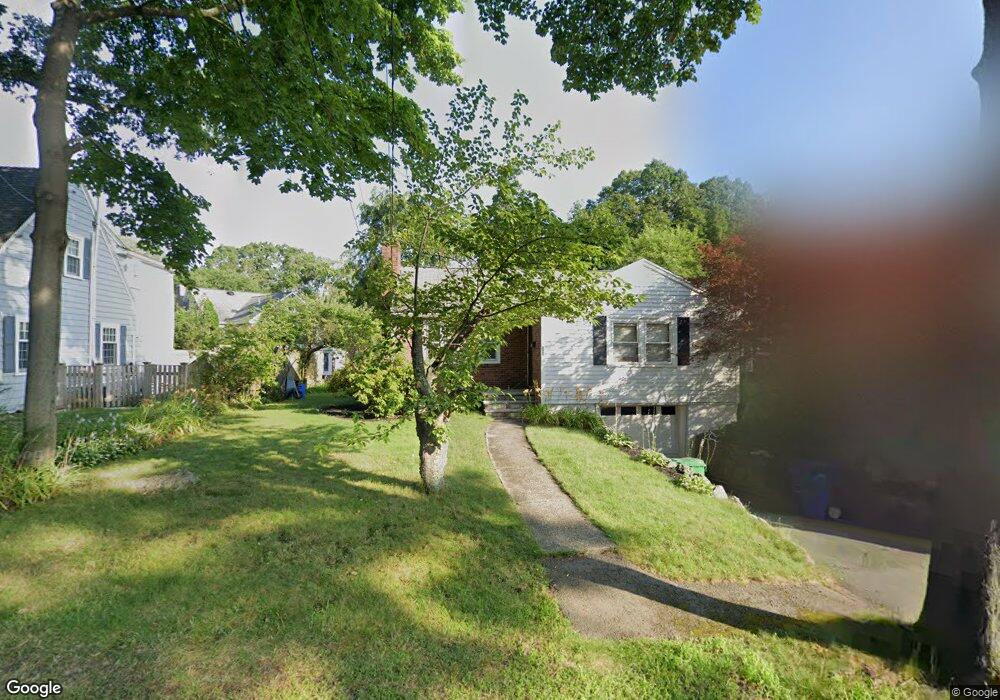
121 Walnut Hill Rd Newton Highlands, MA 02461
Newton Highlands NeighborhoodEstimated Value: $1,041,000 - $1,291,000
4
Beds
2
Baths
1,436
Sq Ft
$792/Sq Ft
Est. Value
About This Home
This home is located at 121 Walnut Hill Rd, Newton Highlands, MA 02461 and is currently estimated at $1,137,651, approximately $792 per square foot. 121 Walnut Hill Rd is a home located in Middlesex County with nearby schools including Countryside Elementary School, Charles E Brown Middle School, and Newton South High School.
Ownership History
Date
Name
Owned For
Owner Type
Purchase Details
Closed on
Jun 7, 2004
Sold by
Wu Jianjun Jay and Yang Tao
Bought by
Ying-Yong Susann Xiao and Yong Theodore Y
Current Estimated Value
Home Financials for this Owner
Home Financials are based on the most recent Mortgage that was taken out on this home.
Original Mortgage
$365,500
Outstanding Balance
$175,352
Interest Rate
5.94%
Mortgage Type
Purchase Money Mortgage
Estimated Equity
$962,299
Purchase Details
Closed on
Jun 26, 2000
Sold by
Lerner Shabtai and Lerner Michaela
Bought by
Wu Jianjun Jay and Yang Tao
Home Financials for this Owner
Home Financials are based on the most recent Mortgage that was taken out on this home.
Original Mortgage
$321,600
Interest Rate
8.48%
Mortgage Type
Purchase Money Mortgage
Purchase Details
Closed on
Sep 15, 1988
Sold by
Verma Dharmendra T
Bought by
Lerner Shabtai
Create a Home Valuation Report for This Property
The Home Valuation Report is an in-depth analysis detailing your home's value as well as a comparison with similar homes in the area
Home Values in the Area
Average Home Value in this Area
Purchase History
| Date | Buyer | Sale Price | Title Company |
|---|---|---|---|
| Ying-Yong Susann Xiao | $568,000 | -- | |
| Wu Jianjun Jay | $402,000 | -- | |
| Lerner Shabtai | $233,000 | -- |
Source: Public Records
Mortgage History
| Date | Status | Borrower | Loan Amount |
|---|---|---|---|
| Open | Ying-Yong Susann Xiao | $365,500 | |
| Previous Owner | Lerner Shabtai | $321,000 | |
| Previous Owner | Lerner Shabtai | $321,600 |
Source: Public Records
Tax History Compared to Growth
Tax History
| Year | Tax Paid | Tax Assessment Tax Assessment Total Assessment is a certain percentage of the fair market value that is determined by local assessors to be the total taxable value of land and additions on the property. | Land | Improvement |
|---|---|---|---|---|
| 2025 | $8,052 | $821,600 | $0 | $0 |
| 2024 | $7,786 | $0 | $0 | $0 |
| 2023 | $7,331 | $720,100 | $662,600 | $57,500 |
| 2022 | $7,015 | $666,800 | $613,500 | $53,300 |
| 2021 | $6,769 | $629,100 | $578,800 | $50,300 |
| 2020 | $6,568 | $629,100 | $578,800 | $50,300 |
| 2019 | $6,383 | $610,800 | $561,900 | $48,900 |
| 2018 | $6,035 | $557,800 | $510,100 | $47,700 |
| 2017 | $5,851 | $526,200 | $481,200 | $45,000 |
| 2016 | $5,597 | $491,800 | $449,700 | $42,100 |
| 2015 | $5,336 | $459,600 | $420,300 | $39,300 |
Source: Public Records
Map
Nearby Homes
- 125 Oakdale Rd
- 1308 Walnut St
- 1292 Walnut St
- 250 Woodcliff Rd
- 19 Selwyn Rd
- 671 Boylston St
- 628 Boylston St
- 625 Boylston St
- 42 Sunhill Ln
- 36 Cannon St
- 21 Philbrick Rd
- 1623-1625 Centre St
- 1629 Centre St
- 1597 Centre St Unit 1597
- 1597 Centre St
- 116 Upland Ave
- 35 Haynes Rd
- 45 Brandeis Rd
- 5 Halcyon Rd
- 1151 Walnut St Unit 205
- 119 Walnut Hill Rd
- 119 Walnut Hill Rd
- 123 Walnut Hill Rd
- 166 Woodcliff Rd
- 160 Woodcliff Rd
- 170 Woodcliff Rd
- 176 Woodcliff Rd
- 156 Woodcliff Rd
- 109 Walnut Hill Rd
- 118 Walnut Hill Rd
- 124 Walnut Hill Rd
- 180 Woodcliff Rd
- 112 Walnut Hill Rd
- 130 Walnut Hill Rd
- 103 Walnut Hill Rd
- 103 Walnut Hill Rd
- 106 Walnut Hill Rd
- 134 Walnut Hill Rd
- 190 Woodcliff Rd
- 110 Parker Ave