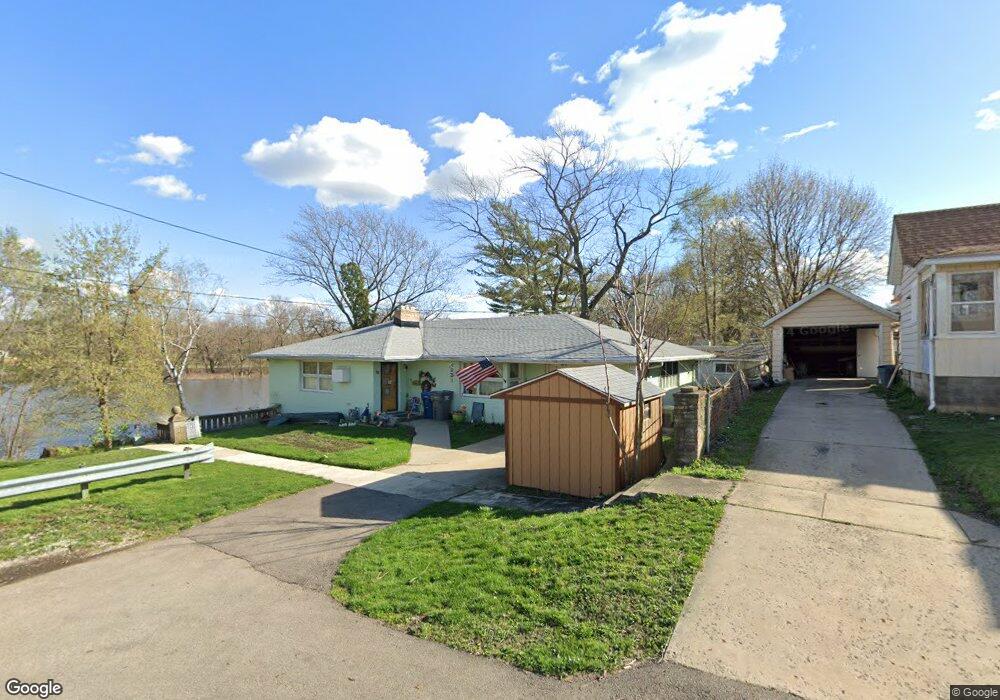
121 Webster St Montgomery, IL 60538
Estimated Value: $286,000 - $336,932
3
Beds
2
Baths
1,605
Sq Ft
$197/Sq Ft
Est. Value
About This Home
This home is located at 121 Webster St, Montgomery, IL 60538 and is currently estimated at $316,733, approximately $197 per square foot. 121 Webster St is a home located in Kane County with nearby schools including Nicholson Elementary School, Washington Middle School, and West Aurora High School.
Ownership History
Date
Name
Owned For
Owner Type
Purchase Details
Closed on
Jun 29, 2006
Sold by
Ceranek Richard A
Bought by
Wollenweber David A
Current Estimated Value
Home Financials for this Owner
Home Financials are based on the most recent Mortgage that was taken out on this home.
Original Mortgage
$114,000
Outstanding Balance
$67,978
Interest Rate
6.73%
Mortgage Type
Purchase Money Mortgage
Estimated Equity
$248,755
Purchase Details
Closed on
Jun 5, 2001
Sold by
Ceranek Sharon J
Bought by
Ceranek Richard A
Purchase Details
Closed on
Dec 13, 1996
Sold by
Curry Lois
Bought by
Ceranek Richard A and Ceranek Sharon J
Home Financials for this Owner
Home Financials are based on the most recent Mortgage that was taken out on this home.
Original Mortgage
$94,500
Interest Rate
7.64%
Create a Home Valuation Report for This Property
The Home Valuation Report is an in-depth analysis detailing your home's value as well as a comparison with similar homes in the area
Home Values in the Area
Average Home Value in this Area
Purchase History
| Date | Buyer | Sale Price | Title Company |
|---|---|---|---|
| Wollenweber David A | $142,500 | Chicago Title Insurance Co | |
| Ceranek Richard A | $5,000 | -- | |
| Ceranek Richard A | $108,000 | Law Title Insurance Co Inc |
Source: Public Records
Mortgage History
| Date | Status | Borrower | Loan Amount |
|---|---|---|---|
| Open | Wollenweber David A | $114,000 | |
| Previous Owner | Ceranek Richard A | $94,500 |
Source: Public Records
Tax History Compared to Growth
Tax History
| Year | Tax Paid | Tax Assessment Tax Assessment Total Assessment is a certain percentage of the fair market value that is determined by local assessors to be the total taxable value of land and additions on the property. | Land | Improvement |
|---|---|---|---|---|
| 2024 | $6,688 | $108,997 | $14,326 | $94,671 |
| 2023 | $2,391 | $97,388 | $12,800 | $84,588 |
| 2022 | $2,877 | $84,537 | $11,679 | $72,858 |
| 2021 | $2,964 | $78,705 | $10,873 | $67,832 |
| 2020 | $5,272 | $73,105 | $10,099 | $63,006 |
| 2019 | $5,075 | $67,734 | $9,357 | $58,377 |
| 2018 | $4,800 | $63,171 | $8,655 | $54,516 |
| 2017 | $4,303 | $56,319 | $7,975 | $48,344 |
| 2016 | $3,518 | $49,545 | $7,196 | $42,349 |
| 2015 | -- | $47,390 | $6,188 | $41,202 |
| 2014 | -- | $46,730 | $5,687 | $41,043 |
| 2013 | -- | $47,169 | $6,038 | $41,131 |
Source: Public Records
Map
Nearby Homes
- 125 S Main St
- 170 Montgomery Rd
- 75 Briarcliff Rd
- 1 Highway 30
- 1342 Oak Ridge Ln
- 133 Autumn Rdg Dr
- 17 Knollwood Dr Unit 3
- 101 Red Fox Run
- 1022 Sard Ave
- 1375 Manning Ave
- 1422 Manning Ave
- 1405 Manning Ave
- 1417 Manning Ave
- 1707 Deer Run Dr
- 29 Briarcliff Rd
- 962 Oliver Ave
- 34 Pembrooke Rd
- 1855 Grandview Place Unit 2B
- 106 Hamlet Cir
- 1336 Douglas Ave Unit 13
- 123 Webster St
- 125 S River St
- 125 Webster St
- 123 S River St
- 111 N River St
- 127 S River St
- 109 N River St
- 109 N River St
- 111 N River St
- 129 S River St
- 213 Webster St
- 211 Webster St
- 114 S River St
- 112 1/2 S River St
- 116 S River St
- 207 S River St
- 212 S River St
- 213 S River St
- 221 Clay St
- 214 S River St