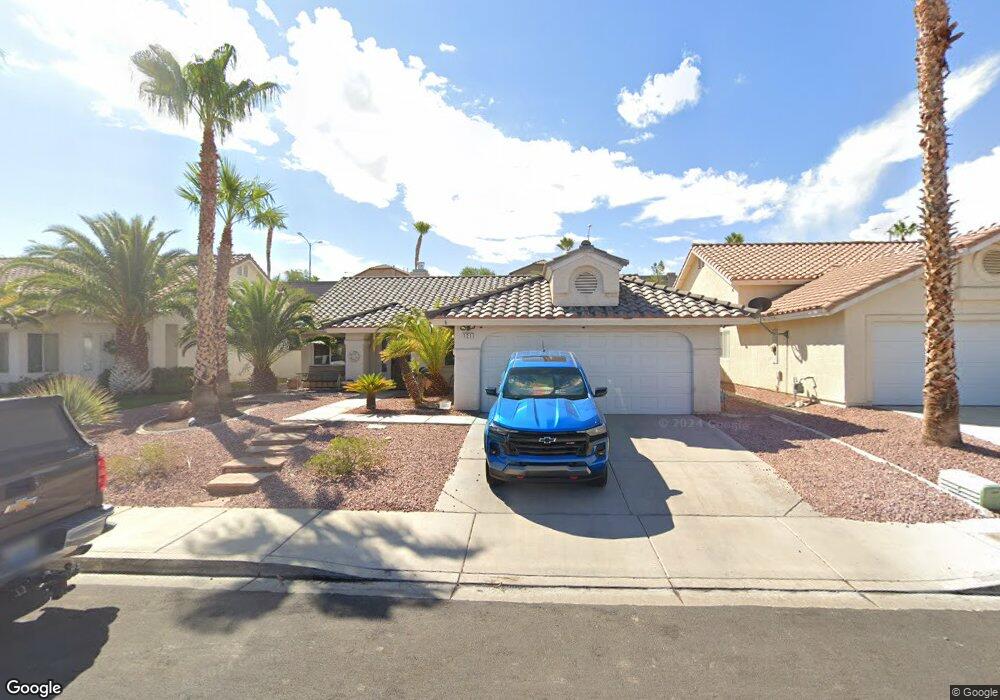
121 Westin Ln Unit 4L Henderson, NV 89002
Paradise Hills NeighborhoodEstimated Value: $442,113 - $471,000
3
Beds
2
Baths
1,668
Sq Ft
$274/Sq Ft
Est. Value
About This Home
This home is located at 121 Westin Ln Unit 4L, Henderson, NV 89002 and is currently estimated at $457,528, approximately $274 per square foot. 121 Westin Ln Unit 4L is a home located in Clark County with nearby schools including J. Marlan Walker International School, Jack & Terry Mannion Middle School, and Foothill High School.
Ownership History
Date
Name
Owned For
Owner Type
Purchase Details
Closed on
Jun 29, 2017
Sold by
Stevens Gregory N
Bought by
Stevens Gregory N and Stevens Allyson R
Current Estimated Value
Home Financials for this Owner
Home Financials are based on the most recent Mortgage that was taken out on this home.
Original Mortgage
$70,000
Outstanding Balance
$58,254
Interest Rate
3.95%
Mortgage Type
Credit Line Revolving
Estimated Equity
$399,274
Purchase Details
Closed on
Apr 25, 2014
Sold by
Stevens Allyson Rochelle
Bought by
Stevens Gregory N
Home Financials for this Owner
Home Financials are based on the most recent Mortgage that was taken out on this home.
Original Mortgage
$125,250
Outstanding Balance
$95,276
Interest Rate
4.28%
Mortgage Type
New Conventional
Estimated Equity
$362,252
Purchase Details
Closed on
Apr 12, 2011
Sold by
Stevens Richard C and Stevens Denise L
Bought by
Stevens Richard C and Stevens Denise L
Home Financials for this Owner
Home Financials are based on the most recent Mortgage that was taken out on this home.
Original Mortgage
$96,750
Interest Rate
5.02%
Mortgage Type
New Conventional
Purchase Details
Closed on
Mar 4, 2011
Sold by
Mortgageit Inc
Bought by
Stevens Richard C and Stevens Denise L
Home Financials for this Owner
Home Financials are based on the most recent Mortgage that was taken out on this home.
Original Mortgage
$96,750
Interest Rate
5.02%
Mortgage Type
New Conventional
Purchase Details
Closed on
Jan 14, 2011
Sold by
Gerling Russell and Gerling Cheryl
Bought by
Mortgageit Inc
Home Financials for this Owner
Home Financials are based on the most recent Mortgage that was taken out on this home.
Original Mortgage
$96,750
Interest Rate
5.02%
Mortgage Type
New Conventional
Purchase Details
Closed on
Oct 22, 2003
Sold by
Favella Chris A and Favella Patricia G
Bought by
Gerling Russell and Gerling Cheryl
Home Financials for this Owner
Home Financials are based on the most recent Mortgage that was taken out on this home.
Original Mortgage
$174,250
Interest Rate
6.5%
Mortgage Type
Unknown
Purchase Details
Closed on
Sep 30, 1996
Sold by
Rainbow Canyon Ltd Liability Company
Bought by
Favella Chris A and Favella Patricia G
Home Financials for this Owner
Home Financials are based on the most recent Mortgage that was taken out on this home.
Original Mortgage
$122,546
Interest Rate
7.95%
Mortgage Type
FHA
Purchase Details
Closed on
May 10, 1996
Sold by
Rainbow Development Corp
Bought by
Rainbow Canyon Ltd Liability Company
Create a Home Valuation Report for This Property
The Home Valuation Report is an in-depth analysis detailing your home's value as well as a comparison with similar homes in the area
Home Values in the Area
Average Home Value in this Area
Purchase History
| Date | Buyer | Sale Price | Title Company |
|---|---|---|---|
| Stevens Gregory N | -- | National Title Co | |
| Stevens Gregory N | -- | Lawyers Title Of Nevada Cha | |
| Stevens Gregory N | $175,000 | Lawyers Title Of Nevada Cha | |
| Stevens Richard C | -- | None Available | |
| Stevens Richard C | $129,000 | Chicago Title The Pointe | |
| Mortgageit Inc | $115,200 | Accommodation | |
| Gerling Russell | $205,000 | Ticor Title Of Nevada Inc | |
| Favella Chris A | $125,000 | United Title | |
| Rainbow Canyon Ltd Liability Company | $1,486,100 | United Title | |
| Rainbow Development Corp | $1,486,100 | United Title |
Source: Public Records
Mortgage History
| Date | Status | Borrower | Loan Amount |
|---|---|---|---|
| Open | Stevens Gregory N | $70,000 | |
| Open | Stevens Gregory N | $125,250 | |
| Closed | Stevens Richard C | $96,750 | |
| Previous Owner | Gerling Russell | $174,250 | |
| Previous Owner | Favella Chris A | $122,546 |
Source: Public Records
Tax History Compared to Growth
Tax History
| Year | Tax Paid | Tax Assessment Tax Assessment Total Assessment is a certain percentage of the fair market value that is determined by local assessors to be the total taxable value of land and additions on the property. | Land | Improvement |
|---|---|---|---|---|
| 2025 | $1,797 | $90,378 | $29,750 | $60,628 |
| 2024 | $1,746 | $90,378 | $29,750 | $60,628 |
| 2023 | $1,746 | $93,507 | $35,700 | $57,807 |
| 2022 | $1,777 | $84,321 | $31,500 | $52,821 |
| 2021 | $1,721 | $77,255 | $26,950 | $50,305 |
| 2020 | $1,595 | $76,968 | $26,950 | $50,018 |
| 2019 | $1,495 | $72,380 | $23,100 | $49,280 |
| 2018 | $1,426 | $67,498 | $19,950 | $47,548 |
| 2017 | $1,925 | $66,426 | $18,200 | $48,226 |
| 2016 | $1,336 | $61,681 | $13,300 | $48,381 |
| 2015 | $1,332 | $56,283 | $10,850 | $45,433 |
| 2014 | $1,291 | $44,988 | $9,800 | $35,188 |
Source: Public Records
Map
Nearby Homes
- 132 Westin Ln
- 837 Holly Lake Way
- 1010 Silver Retreat Ct
- 107 Mint Orchard Dr
- 110 Mint Orchard Dr
- 181 Ridge Crossing Ave
- 780 Vortex Ave
- 1014 Pleasing Plateau St
- 131 Park Ridge Ln
- 854 Coral Cottage Dr
- 1044 Spanish Needle St
- 43 Pangloss St
- 1034 Copper Palm Ct
- 815 Sun Bridge Ln
- 1028 Twin Berry Ct
- 0 E Mission Dr
- 787 Craigmark Ct
- 730 Descartes Ave
- 805 Blue Springs Dr
- 87 Rattlesnake Grass Ct
- 123 Westin Ln
- 119 Westin Ln
- 125 Westin Ln
- 117 Westin Ln
- 120 Beach Oak Ave
- 127 Westin Ln
- 115 Westin Ln
- 124 Westin Ln
- 122 Beach Oak Ave
- 1000 Snow Bunting Ct
- 1001 Silver Retreat Ct
- 1001 Silver Retreat Ct Unit na
- 116 Westin Ln
- 129 Westin Ln
- 113 Westin Ln
- 126 Westin Ln
- 114 Westin Ln
- 1001 Snow Bunting Ct
- 128 Westin Ln
- 124 Beach Oak Ave Unit n/a