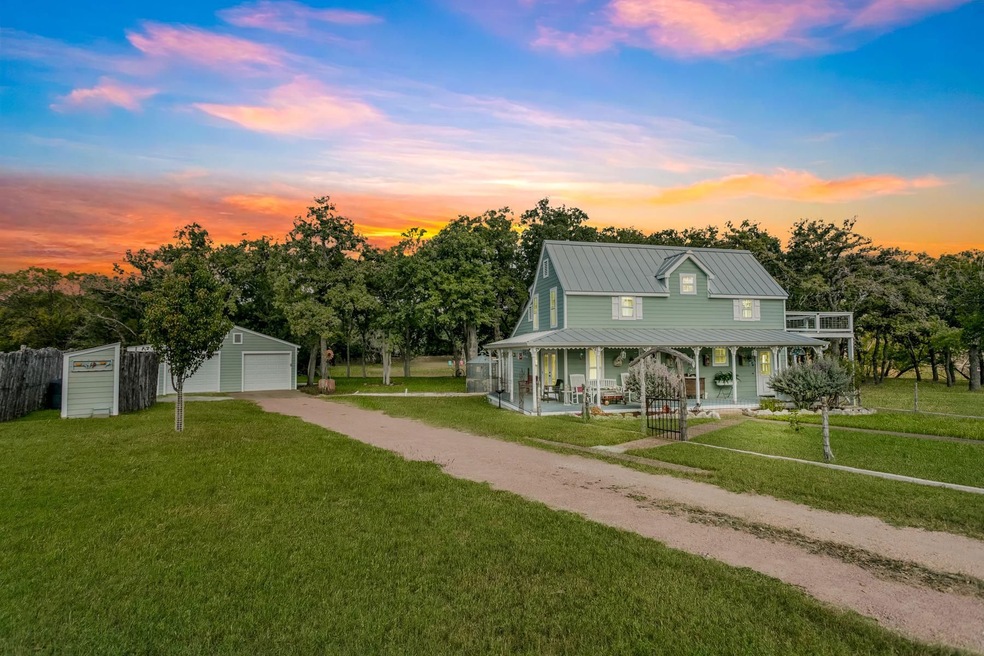
121 Winding Oak Dr Fredericksburg, TX 78624
Estimated payment $3,768/month
About This Home
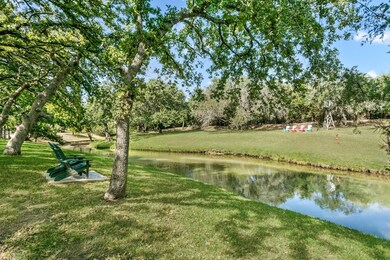
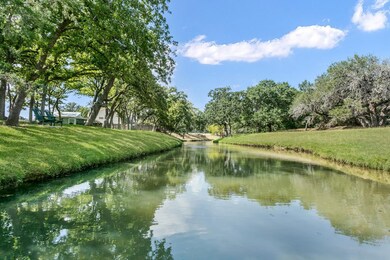
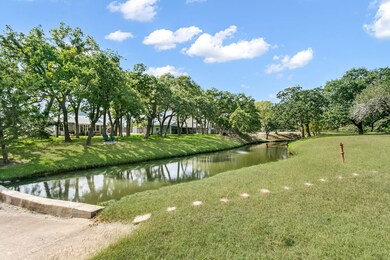
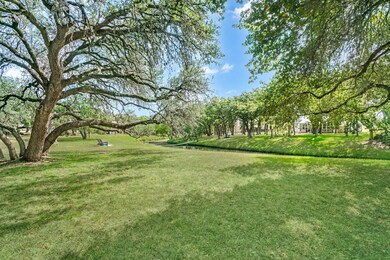
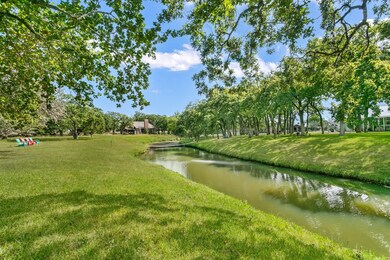
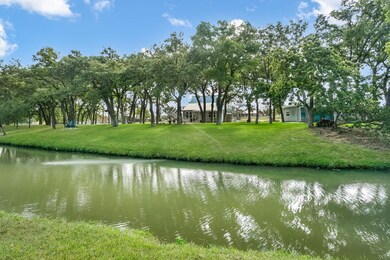
Nestled on a picturesque, post oak-studded lot, this extraordinary property offers a rare opportunity to own both sides of a serene creek, creating an idyllic private oasis just minutes from everything you need. Whether you're looking for a peaceful retreat or an investment opportunity, this home delivers. With its close proximity to shopping, dining, and entertainment, plus the added potential for use as a short-term rental (STR), this property is as versatile as it is unique. Enjoy the tranquility of the creek, surrounded by mature oak trees, while still being centrally located to all the amenities of city living. Whether you're relaxing by the water, hosting guests, or utilizing it as an STR, this property offers endless possibilities. Dont miss your chance to own a piece of natures beauty with convenience at your doorstep.

Home Details
Home Type
- Single Family
Est. Annual Taxes
- $4,098
Bedrooms and Bathrooms
- 3 Bedrooms
Map
Home Values in the Area
Average Home Value in this Area
Tax History
| Year | Tax Paid | Tax Assessment Tax Assessment Total Assessment is a certain percentage of the fair market value that is determined by local assessors to be the total taxable value of land and additions on the property. | Land | Improvement |
|---|---|---|---|---|
| 2025 | $4,098 | $391,564 | $123,910 | $276,910 |
| 2024 | $4,098 | $355,967 | $123,910 | $270,500 |
| 2023 | $3,430 | $323,606 | $123,910 | $270,500 |
| 2022 | $3,821 | $326,960 | $93,910 | $233,050 |
| 2021 | $3,921 | $287,780 | $71,250 | $216,530 |
| 2020 | $3,635 | $243,130 | $71,250 | $171,880 |
| 2019 | $3,796 | $243,130 | $71,250 | $171,880 |
| 2018 | $3,517 | $231,880 | $60,000 | $171,880 |
| 2017 | $3,269 | $225,740 | $60,000 | $165,740 |
| 2016 | $2,972 | $187,090 | $50,000 | $137,090 |
| 2015 | -- | $195,230 | $50,000 | $145,230 |
| 2014 | -- | $187,090 | $50,000 | $137,090 |
Property History
| Date | Event | Price | List to Sale | Price per Sq Ft |
|---|---|---|---|---|
| 11/06/2025 11/06/25 | For Sale | $650,000 | -- | $438 / Sq Ft |
Purchase History
| Date | Type | Sale Price | Title Company |
|---|---|---|---|
| Warranty Deed | -- | None Available |
- 959 & 985 S Eagle St
- 102 Baume Ct Unit 46
- 110 Baume Ct Unit 50A
- 106 Baume Ct Unit 48
- 109 Baume Ct Unit 55
- 112 Baume Ct Unit 51
- 108 Baume Ct Unit 49
- 110 & 112 Baume Ct
- 111 Baume Ct Unit 54
- 930 S Eagle St Unit 203
- 930 S Eagle St Unit 102
- 930 S Eagle St Unit 104
- 118 Baurenhof Ct
- 960 S Eagle St Unit 4
- 1412 S Eagle St
- 517 Interlaken St
- 511 Interlaken St
- LOT 43--105 Baurenhof Ct
- 102 Baurenhof Ct
- 101 Baurenhof Ct
- 1019 Friendship Ln
- 707 S Creek St
- 604 S Eagle St
- 607 S Columbus St
- 705 E Highway St Unit 104
- 510 S Olive St
- 206 Skylark Dr
- 605 S Washington St Unit A
- 1125 S Adams St
- 1003 Henrietta St
- 202 E Ufer St
- 175 Friendship Ln
- 201 W Walch Ave
- 109 W Travis St Unit MH
- 387 Schmidtzinsky Rd
- 619 W Live Oak St
- 308 W Schubert St
- 747 Darlington Dr
- 106 W Mulberry St
- 802 Gray Oak Ct