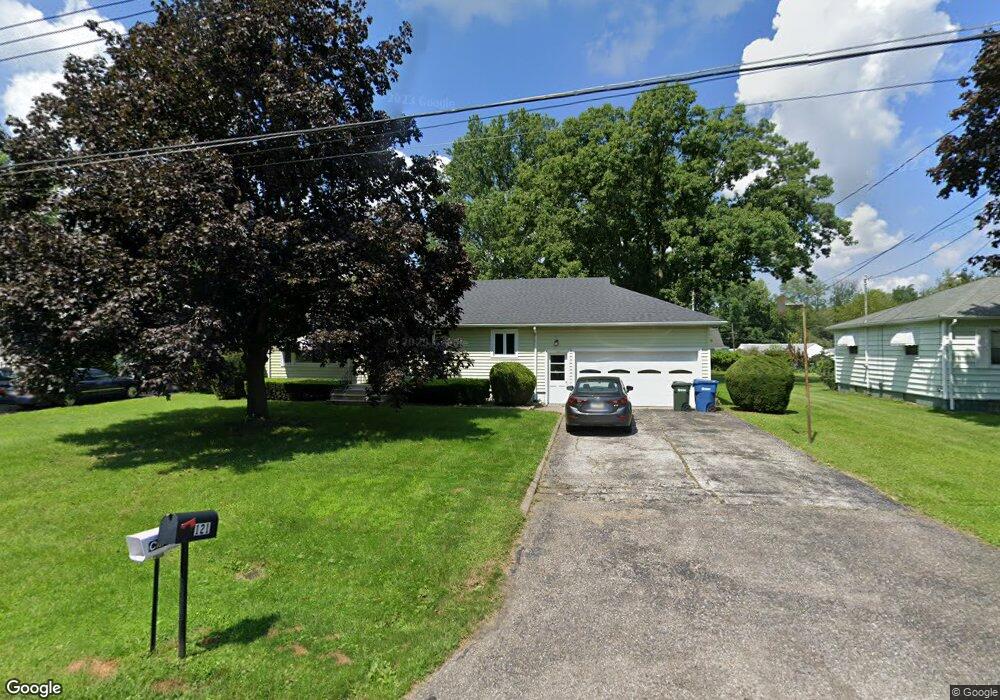
121 Yunker Ct Elyria, OH 44035
Estimated Value: $178,000 - $217,000
3
Beds
1
Bath
1,064
Sq Ft
$184/Sq Ft
Est. Value
About This Home
This home is located at 121 Yunker Ct, Elyria, OH 44035 and is currently estimated at $195,981, approximately $184 per square foot. 121 Yunker Ct is a home located in Lorain County with nearby schools including Midview West Elementary School, Midview North Elementary School, and Midview Middle School.
Ownership History
Date
Name
Owned For
Owner Type
Purchase Details
Closed on
Jul 11, 2022
Sold by
Wolf-Dove Sandra J
Bought by
Hodge Louis John Timothy
Current Estimated Value
Home Financials for this Owner
Home Financials are based on the most recent Mortgage that was taken out on this home.
Original Mortgage
$120,000
Outstanding Balance
$114,176
Interest Rate
5.1%
Mortgage Type
Balloon
Estimated Equity
$81,805
Purchase Details
Closed on
Oct 24, 2002
Sold by
Plas Beatrice E
Bought by
Plas Beatrice E and Beatrice E Plas Trust
Create a Home Valuation Report for This Property
The Home Valuation Report is an in-depth analysis detailing your home's value as well as a comparison with similar homes in the area
Home Values in the Area
Average Home Value in this Area
Purchase History
| Date | Buyer | Sale Price | Title Company |
|---|---|---|---|
| Hodge Louis John Timothy | $160,000 | New Title Company Name | |
| Plas Beatrice E | -- | -- |
Source: Public Records
Mortgage History
| Date | Status | Borrower | Loan Amount |
|---|---|---|---|
| Open | Hodge Louis John Timothy | $120,000 |
Source: Public Records
Tax History
| Year | Tax Paid | Tax Assessment Tax Assessment Total Assessment is a certain percentage of the fair market value that is determined by local assessors to be the total taxable value of land and additions on the property. | Land | Improvement |
|---|---|---|---|---|
| 2024 | $2,302 | $51,153 | $11,211 | $39,942 |
| 2023 | $1,859 | $37,265 | $10,619 | $26,646 |
| 2022 | $1,900 | $37,265 | $10,619 | $26,646 |
| 2021 | $1,431 | $37,265 | $10,619 | $26,646 |
| 2020 | $1,223 | $31,550 | $8,990 | $22,560 |
| 2019 | $1,218 | $31,550 | $8,990 | $22,560 |
| 2018 | $1,353 | $31,550 | $8,990 | $22,560 |
| 2017 | $1,476 | $34,130 | $11,690 | $22,440 |
| 2016 | $1,495 | $34,130 | $11,690 | $22,440 |
| 2015 | $1,481 | $34,130 | $11,690 | $22,440 |
| 2014 | $1,489 | $34,130 | $11,690 | $22,440 |
| 2013 | $1,490 | $34,130 | $11,690 | $22,440 |
Source: Public Records
Map
Nearby Homes
- 38867 Butternut Ridge Rd
- 11259 Robson Rd
- 39046 E River Rd
- 39277 Butternut Ridge Rd
- 10832 Indian Hollow Rd
- 133 Gleneagle Dr Unit 47
- 39535 Butternut Ridge Rd
- 10273 E River Rd
- 110 Harvest Way
- 38227 Chestnut Ridge Rd
- 219 Bridgeport Dr Unit 35
- 121 Oakley Green Dr Unit 13
- 124 Oakley Green Dr
- 715 Carol Ln
- 401 River Run Dr
- 475 Carol Ln
- 11241 Durkee Rd
- 430 Pheasant Run
- 426 Pheasant Run
- 422 Pheasant Run
Your Personal Tour Guide
Ask me questions while you tour the home.