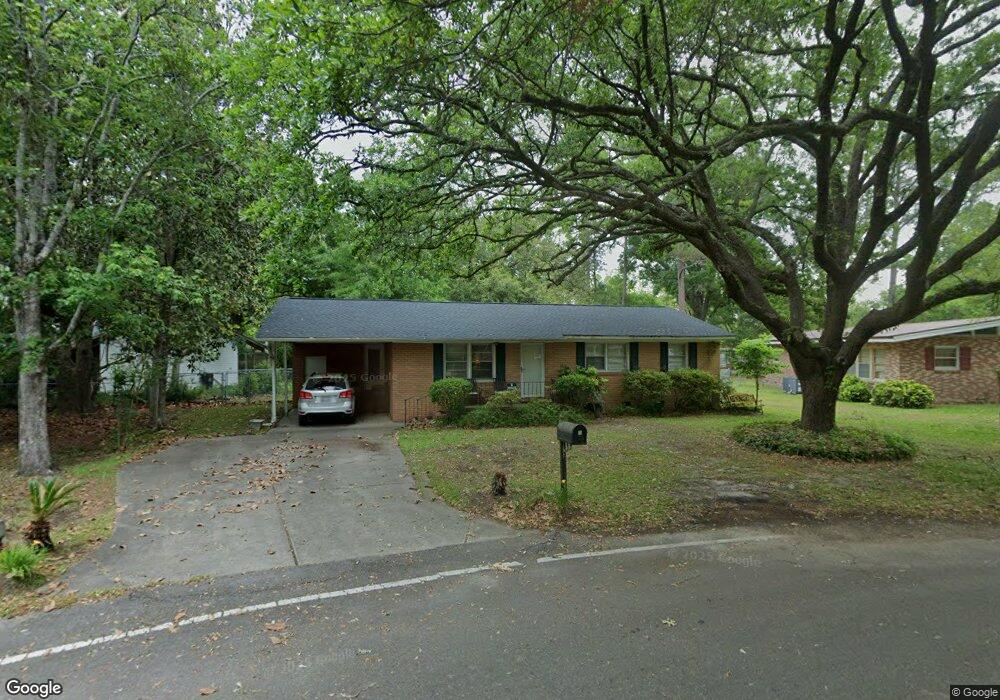
1210 13th Ave Conway, SC 29526
Estimated Value: $175,000 - $254,030
3
Beds
2
Baths
1,227
Sq Ft
$180/Sq Ft
Est. Value
About This Home
This home is located at 1210 13th Ave, Conway, SC 29526 and is currently estimated at $220,758, approximately $179 per square foot. 1210 13th Ave is a home located in Horry County with nearby schools including Conway Elementary School, Conway Middle School, and Conway High School.
Ownership History
Date
Name
Owned For
Owner Type
Purchase Details
Closed on
Aug 11, 2006
Sold by
Gianuca Doris M
Bought by
Floyd Richard S
Current Estimated Value
Home Financials for this Owner
Home Financials are based on the most recent Mortgage that was taken out on this home.
Original Mortgage
$26,580
Outstanding Balance
$15,546
Interest Rate
6.67%
Mortgage Type
Unknown
Estimated Equity
$205,212
Purchase Details
Closed on
Jun 10, 2005
Sold by
Davis Kyle Samuel and Davis Randall E
Bought by
Gianuca Doris M
Home Financials for this Owner
Home Financials are based on the most recent Mortgage that was taken out on this home.
Original Mortgage
$74,865
Interest Rate
7.65%
Mortgage Type
Purchase Money Mortgage
Purchase Details
Closed on
Jan 21, 2002
Sold by
Lesley Myrtle and Ward Avis L
Bought by
Davis Kyle Samuel
Home Financials for this Owner
Home Financials are based on the most recent Mortgage that was taken out on this home.
Original Mortgage
$75,000
Interest Rate
7.25%
Mortgage Type
Purchase Money Mortgage
Create a Home Valuation Report for This Property
The Home Valuation Report is an in-depth analysis detailing your home's value as well as a comparison with similar homes in the area
Home Values in the Area
Average Home Value in this Area
Purchase History
| Date | Buyer | Sale Price | Title Company |
|---|---|---|---|
| Floyd Richard S | $132,900 | None Available | |
| Gianuca Doris M | $108,500 | -- | |
| Davis Kyle Samuel | $86,500 | -- |
Source: Public Records
Mortgage History
| Date | Status | Borrower | Loan Amount |
|---|---|---|---|
| Open | Floyd Richard S | $26,580 | |
| Open | Floyd Richard S | $99,675 | |
| Previous Owner | Gianuca Doris M | $74,865 | |
| Previous Owner | Davis Kyle Samuel | $75,000 |
Source: Public Records
Tax History
| Year | Tax Paid | Tax Assessment Tax Assessment Total Assessment is a certain percentage of the fair market value that is determined by local assessors to be the total taxable value of land and additions on the property. | Land | Improvement |
|---|---|---|---|---|
| 2025 | $1,998 | $0 | $0 | $0 |
| 2024 | $1,998 | $12,926 | $5,100 | $7,826 |
| 2023 | $0 | $6,449 | $1,578 | $4,871 |
| 2021 | $1,703 | $8,227 | $1,699 | $6,528 |
| 2020 | $1,643 | $8,227 | $1,699 | $6,528 |
| 2019 | $1,643 | $8,227 | $1,699 | $6,528 |
| 2018 | $0 | $5,608 | $1,372 | $4,236 |
| 2017 | $0 | $5,608 | $1,372 | $4,236 |
| 2016 | $0 | $5,608 | $1,372 | $4,236 |
| 2015 | -- | $5,608 | $1,372 | $4,236 |
| 2014 | $1,463 | $5,608 | $1,372 | $4,236 |
Source: Public Records
Map
Nearby Homes
- 2616 Hudson Trail
- 1305 Forest View Rd
- 116 Kingsbury Loop Unit C
- 1006 10th Ave
- 1229 Park Hill Dr
- 1105 Hickory Dr
- 1170 Oak Meadows Dr
- 1170 Oak Meadows Dr Unit Lot 141
- 1505 Jenkins Dr
- 708 15th Ave
- 1011 Hickory Cir
- 1605 Sessions St
- 1503 Ward Cir
- 1011 Tin Top Aly
- 0 Mill Pond Rd Unit 2507308
- 1009 Tin Top Aly
- TBD Mill Pond Rd
- 903 Durant St
- 1541 Stilley Cir
- 1547 Stilley Cir
- 1208 13th Ave
- 2501 Riverboat Way
- 2501 Riverboat Way
- 2429 Riverboat Way Unit Lot 150- Aria B
- 2553 Revolutionary Way Unit Lot 171- Dover C
- 2407 Riverboat Way Unit Lot 153-Wren B
- 2509 Revolutionary Way Unit Lot 164 - Wren A
- 2424 Riverboat Way Unit Lot 106- Galen B
- 2502 Riverboat Way Unit Lot 183- Aria B
- 2420 Riverboat Way Unit Lot 105- Aria B
- 2408 Riverboat Way Unit Lot 102- Dover C
- 2416 Riverboat Way Unit Lot 104-Wren A
- 2506 Riverboat Way Unit Lot 182- Cali A
- 2501 Riverboat Way Unit Lot 148- Cali B
- 2433 Riverboat Way Unit Lot 149-Wren A
- 2421 Riverboat Way Unit Lot 152- Cali A
- 2404 Riverboat Way Unit Lot 101- Cali B
- 2505 Riverboat Way Unit Lot 147- Dover C
- 2425 Riverboat Way Unit Lot 151- Dover A
- 2412 Riverboat Way Unit Lot 103- Galen B
Your Personal Tour Guide
Ask me questions while you tour the home.