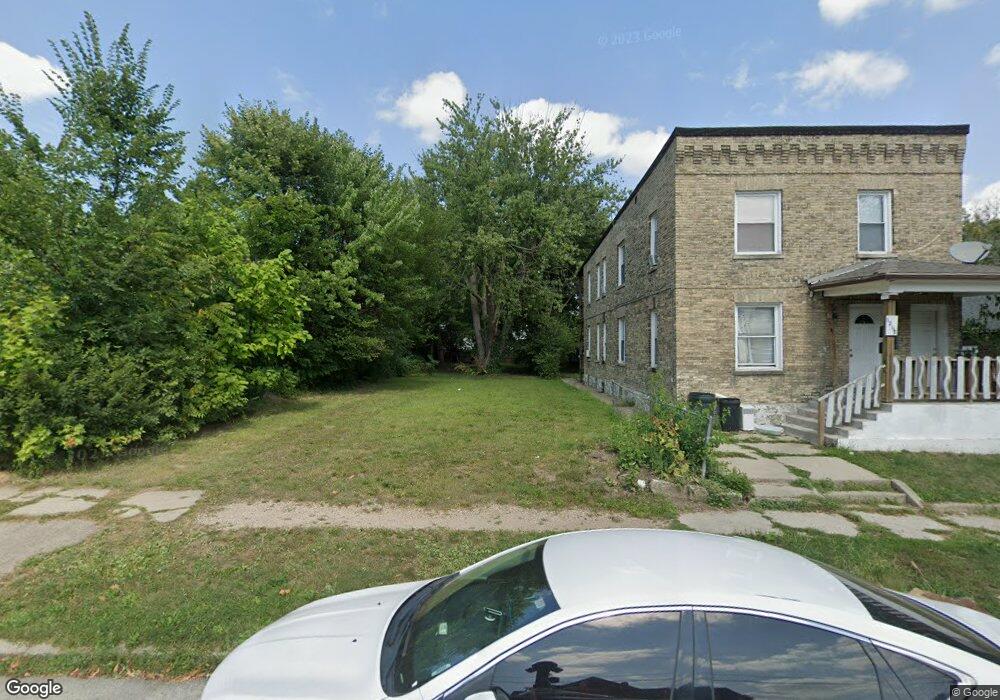
1210 6th Ave Rockford, IL 61104
Midtown District NeighborhoodEstimated Value: $88,000 - $116,000
3
Beds
1
Bath
1,119
Sq Ft
$90/Sq Ft
Est. Value
About This Home
This home is located at 1210 6th Ave, Rockford, IL 61104 and is currently estimated at $100,554, approximately $89 per square foot. 1210 6th Ave is a home located in Winnebago County with nearby schools including Bloom Elementary School, Abraham Lincoln Middle School, and Rockford East High School.
Ownership History
Date
Name
Owned For
Owner Type
Purchase Details
Closed on
May 7, 2021
Sold by
City Of Rockford
Bought by
Smith Ryan J
Current Estimated Value
Purchase Details
Closed on
Jun 5, 2019
Sold by
Wells Fargo Bank Na
Bought by
City Of Rockford Illinois
Purchase Details
Closed on
May 3, 2019
Sold by
Wells Fargo Bank Na
Bought by
City Of Rockford Illinois
Purchase Details
Closed on
Nov 30, 2018
Sold by
Johnson Michael R
Bought by
Wells Fargo Bk Na
Purchase Details
Closed on
Nov 26, 2018
Sold by
Johnson Michael R
Bought by
Wells Fargo Bk Na
Create a Home Valuation Report for This Property
The Home Valuation Report is an in-depth analysis detailing your home's value as well as a comparison with similar homes in the area
Home Values in the Area
Average Home Value in this Area
Purchase History
| Date | Buyer | Sale Price | Title Company |
|---|---|---|---|
| Smith Ryan J | -- | None Listed On Document | |
| City Of Rockford Illinois | -- | Codilis & Associates Pc | |
| City Of Rockford Illinois | -- | Codilis & Associates Pc | |
| Wells Fargo Bk Na | -- | Title Underwriters Agency | |
| Wells Fargo Bank Na | -- | Codilis & Associates Pc | |
| Wells Fargo Bk Na | -- | Title Underwriters Agency | |
| Wells Fargo Bank Na | -- | Codilis & Associates Pc |
Source: Public Records
Tax History
| Year | Tax Paid | Tax Assessment Tax Assessment Total Assessment is a certain percentage of the fair market value that is determined by local assessors to be the total taxable value of land and additions on the property. | Land | Improvement |
|---|---|---|---|---|
| 2024 | $137 | $1,443 | $1,443 | -- |
| 2023 | $132 | $1,272 | $1,272 | $0 |
| 2022 | $130 | $1,137 | $1,137 | $0 |
| 2021 | $128 | $1,043 | $1,043 | $0 |
| 2020 | $127 | $986 | $986 | $0 |
| 2019 | $1,375 | $10,265 | $940 | $9,325 |
| 2018 | $1,385 | $9,675 | $886 | $8,789 |
| 2017 | $1,374 | $9,259 | $848 | $8,411 |
| 2016 | $1,372 | $9,085 | $832 | $8,253 |
| 2015 | $1,390 | $9,085 | $832 | $8,253 |
| 2014 | $2,054 | $12,132 | $1,036 | $11,096 |
Source: Public Records
Map
Nearby Homes
Your Personal Tour Guide
Ask me questions while you tour the home.