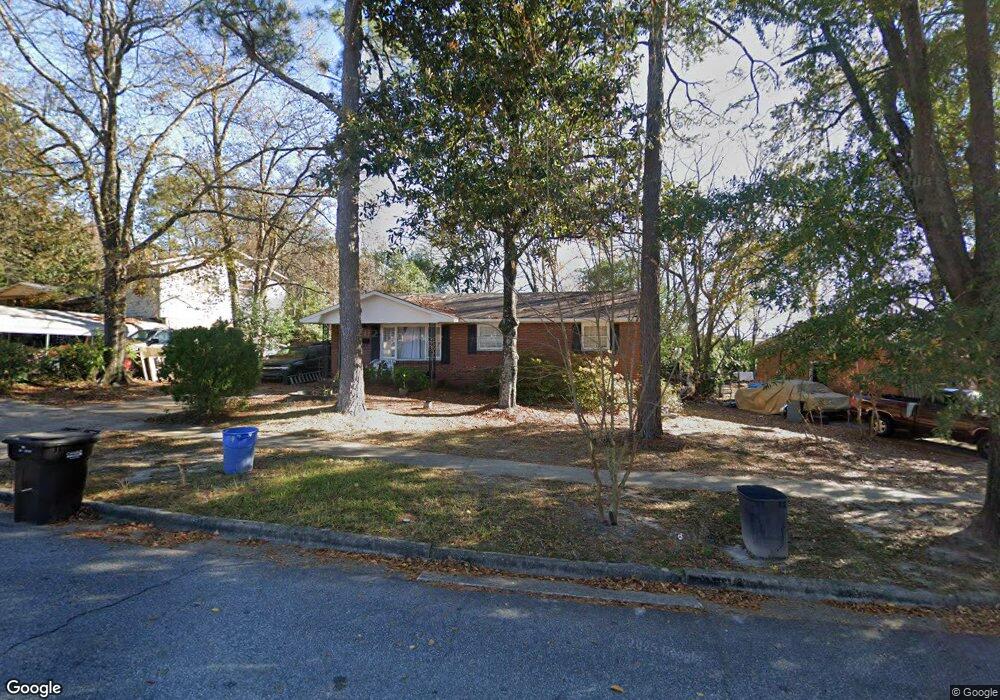
1210 9th St Columbus, GA 31906
Bottoms-Meeler's Hill NeighborhoodEstimated Value: $102,000 - $160,000
3
Beds
3
Baths
1,806
Sq Ft
$71/Sq Ft
Est. Value
About This Home
This home is located at 1210 9th St, Columbus, GA 31906 and is currently estimated at $128,906, approximately $71 per square foot. 1210 9th St is a home located in Muscogee County with nearby schools including Davis Elementary School, Baker Middle School, and Jordan Vocational High School.
Ownership History
Date
Name
Owned For
Owner Type
Purchase Details
Closed on
Sep 24, 2007
Sold by
Williams George
Bought by
Williams Voncille C and Williams George
Current Estimated Value
Home Financials for this Owner
Home Financials are based on the most recent Mortgage that was taken out on this home.
Original Mortgage
$66,750
Outstanding Balance
$42,262
Interest Rate
6.57%
Mortgage Type
Purchase Money Mortgage
Estimated Equity
$86,644
Create a Home Valuation Report for This Property
The Home Valuation Report is an in-depth analysis detailing your home's value as well as a comparison with similar homes in the area
Home Values in the Area
Average Home Value in this Area
Purchase History
| Date | Buyer | Sale Price | Title Company |
|---|---|---|---|
| Williams Voncille C | -- | -- | |
| Williams Voncille C | -- | None Available |
Source: Public Records
Mortgage History
| Date | Status | Borrower | Loan Amount |
|---|---|---|---|
| Open | Williams Voncille C | $66,750 |
Source: Public Records
Tax History
| Year | Tax Paid | Tax Assessment Tax Assessment Total Assessment is a certain percentage of the fair market value that is determined by local assessors to be the total taxable value of land and additions on the property. | Land | Improvement |
|---|---|---|---|---|
| 2025 | $70 | $34,360 | $3,748 | $30,612 |
| 2024 | $68 | $34,360 | $3,748 | $30,612 |
| 2023 | $12 | $34,360 | $3,748 | $30,612 |
| 2022 | $71 | $27,796 | $3,748 | $24,048 |
| 2021 | $64 | $26,236 | $3,748 | $22,488 |
| 2020 | $64 | $26,236 | $3,748 | $22,488 |
| 2019 | $66 | $26,236 | $3,748 | $22,488 |
| 2018 | $66 | $26,236 | $3,748 | $22,488 |
| 2017 | $68 | $26,236 | $3,748 | $22,488 |
| 2016 | $70 | $18,960 | $2,240 | $16,720 |
| 2015 | $70 | $18,960 | $2,240 | $16,720 |
| 2014 | $71 | $18,960 | $2,240 | $16,720 |
| 2013 | -- | $18,960 | $2,240 | $16,720 |
Source: Public Records
Map
Nearby Homes
- 1103 Martin Luther King Junior Blvd
- 912 Magnolia Ave
- 911 Oakview Ave
- 1011 Blandford Ave
- 1000 Peachtree Dr
- 1814 Elmwood Dr
- 1811 Park Dr
- 2551 Wynnton Rd
- 1820 Overlook St
- 1242 18th Ave
- 752 Portland Ave
- 811 3rd Ave
- 2005 7th St
- 816 2nd Ave
- 804 2nd Ave
- 2039 8th St
- 1400 17th Ave
- 731 2nd Ave
- 508 3rd Ave
- 1333 Springer St