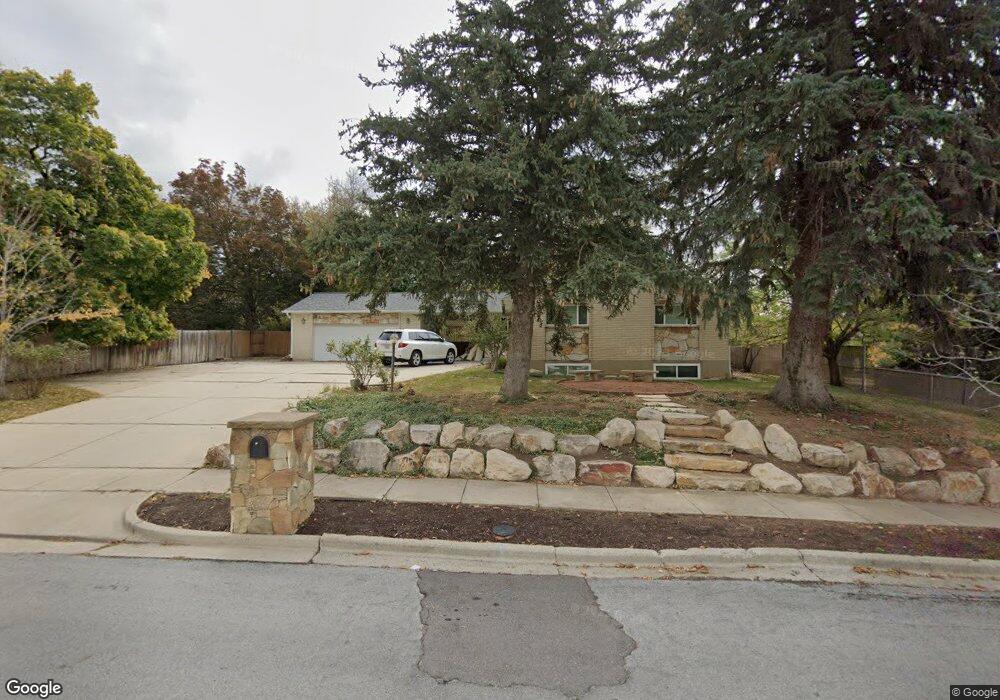
1210 Bountiful Hills Dr Bountiful, UT 84010
Estimated Value: $630,000 - $691,000
6
Beds
3
Baths
2,978
Sq Ft
$223/Sq Ft
Est. Value
About This Home
This home is located at 1210 Bountiful Hills Dr, Bountiful, UT 84010 and is currently estimated at $665,533, approximately $223 per square foot. 1210 Bountiful Hills Dr is a home located in Davis County with nearby schools including Oak Hills School, Millcreek Junior High School, and Bountiful High School.
Ownership History
Date
Name
Owned For
Owner Type
Purchase Details
Closed on
Feb 13, 2020
Sold by
Gallegos Marshall
Bought by
Gallegos Janetha
Current Estimated Value
Home Financials for this Owner
Home Financials are based on the most recent Mortgage that was taken out on this home.
Original Mortgage
$375,000
Outstanding Balance
$331,327
Interest Rate
3.6%
Mortgage Type
New Conventional
Estimated Equity
$334,206
Purchase Details
Closed on
Jul 6, 2009
Sold by
Odekirk Lorene H
Bought by
Benson Douglas E and Benson Lindsay D
Home Financials for this Owner
Home Financials are based on the most recent Mortgage that was taken out on this home.
Original Mortgage
$286,318
Interest Rate
5.25%
Mortgage Type
FHA
Purchase Details
Closed on
Jan 22, 2009
Sold by
Odekirk Lorene H
Bought by
Odekirk Lorene H and Lorene H Odekirk Family Trust
Purchase Details
Closed on
Aug 6, 2002
Sold by
Lund Victor L
Bought by
Odekirk Jerry R and Odekirk Lorene H
Create a Home Valuation Report for This Property
The Home Valuation Report is an in-depth analysis detailing your home's value as well as a comparison with similar homes in the area
Purchase History
| Date | Buyer | Sale Price | Title Company |
|---|---|---|---|
| Gallegos Janetha | -- | Stewart Title Ins | |
| Benson Douglas E | -- | First American Title | |
| Odekirk Lorene H | -- | None Available | |
| Odekirk Jerry R | -- | Aspen Title Insurance Agency |
Source: Public Records
Mortgage History
| Date | Status | Borrower | Loan Amount |
|---|---|---|---|
| Open | Gallegos Janetha | $375,000 | |
| Closed | Benson Douglas E | $286,318 |
Source: Public Records
Tax History
| Year | Tax Paid | Tax Assessment Tax Assessment Total Assessment is a certain percentage of the fair market value that is determined by local assessors to be the total taxable value of land and additions on the property. | Land | Improvement |
|---|---|---|---|---|
| 2025 | $3,703 | $326,150 | $188,425 | $137,725 |
| 2024 | $3,463 | $315,700 | $172,878 | $142,822 |
| 2023 | $3,452 | $574,000 | $324,752 | $249,248 |
| 2022 | $3,650 | $325,050 | $174,535 | $150,515 |
| 2021 | $3,483 | $457,000 | $260,400 | $196,600 |
| 2020 | $2,973 | $379,000 | $236,851 | $142,149 |
| 2019 | $2,785 | $372,000 | $208,820 | $163,180 |
| 2018 | $2,619 | $343,000 | $197,154 | $145,846 |
| 2016 | $2,275 | $165,221 | $82,121 | $83,100 |
| 2015 | $2,254 | $154,606 | $82,121 | $72,485 |
| 2014 | $2,201 | $155,599 | $82,121 | $73,478 |
| 2013 | -- | $134,589 | $73,454 | $61,135 |
Source: Public Records
Map
Nearby Homes
- 861 E Millbrook Way
- 1138 Briggs Dr
- 795 Abby Ln Unit 5
- 1785 1450 E Unit 604
- 0 Lot Bountiful Blvd
- 1475 Mueller Park Rd
- 1596 E Millbrook Way
- 1087 Arlington Way
- 1735 S Temple Ct Unit 203
- 631 E 1700 S
- 1987 Mapleview Dr
- 520 S Orchard Dr Unit 17
- 2136 Elaine Dr
- 323 Peach Ln
- 380 E 1500 S
- 337 Peach Ln
- 683 E 100 N
- 275 E Peach Ln S
- 285 E 1100 S
- 438 E 1800 S
- 932 Canyon Crest Dr
- 968 Canyon Crest Dr
- 1211 Bountiful Hills Dr
- 1195 Bountiful Hills Dr
- 1235 Bountiful Hills Dr
- 1008 Canyon Crest Dr
- 1175 Woodmoor Dr
- 945 Canyon Crest Dr
- 939 Canyon Crest Dr
- 1163 Bountiful Hills Dr
- 965 Canyon Crest Dr
- 1036 Canyon Crest Dr
- 850 Canyon Crest Dr
- 849 Woodmoor Cir
- 819 Woodmoor Cir
- 1144 Woodmoor Dr
- 1147 Bountiful Hills Dr
- 1151 Woodmoor Dr
- 1035 Canyon Crest Dr
- 987 Canyon Crest Dr
Your Personal Tour Guide
Ask me questions while you tour the home.