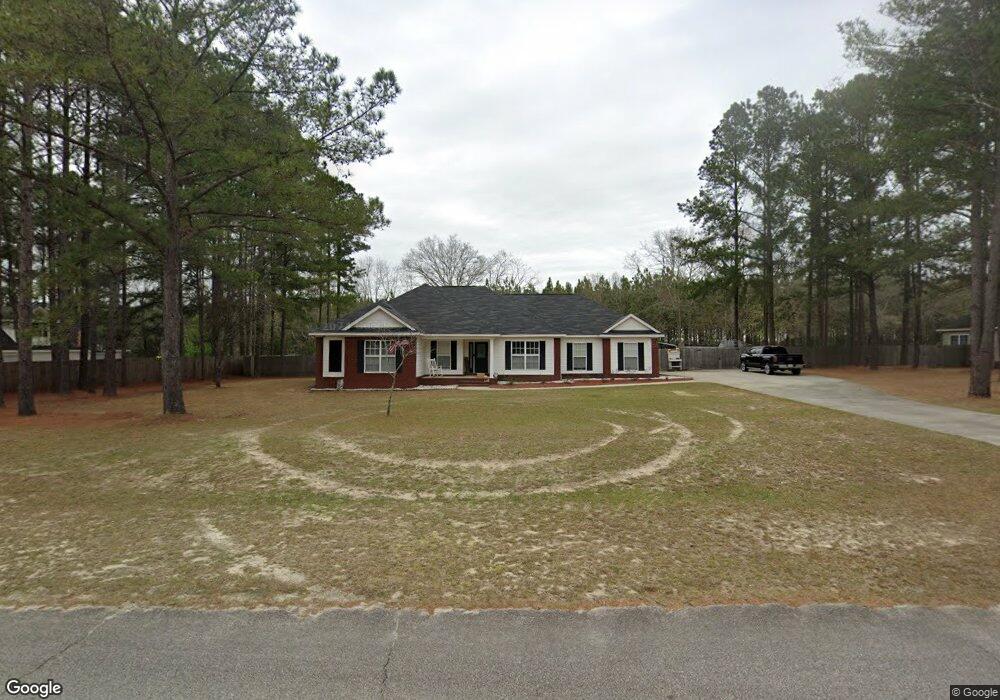
1210 Brooklet South Dr Unit L0T 6 Brooklet, GA 30415
Estimated Value: $330,000 - $370,000
4
Beds
2
Baths
1,851
Sq Ft
$185/Sq Ft
Est. Value
About This Home
This home is located at 1210 Brooklet South Dr Unit L0T 6, Brooklet, GA 30415 and is currently estimated at $342,885, approximately $185 per square foot. 1210 Brooklet South Dr Unit L0T 6 is a home located in Bulloch County with nearby schools including Southeast Bulloch High School, Brooklet Elementary School, and Southeast Bulloch Middle School.
Ownership History
Date
Name
Owned For
Owner Type
Purchase Details
Closed on
Apr 3, 2014
Sold by
Pepper Paul E
Bought by
Guadagno Vincent S and Guadagno Suzette N
Current Estimated Value
Home Financials for this Owner
Home Financials are based on the most recent Mortgage that was taken out on this home.
Original Mortgage
$17,000
Outstanding Balance
$12,918
Interest Rate
4.33%
Mortgage Type
FHA
Estimated Equity
$329,967
Purchase Details
Closed on
Mar 21, 2013
Sold by
Pepper Paul
Bought by
Pepper Paul and Hughes Deborah Pepper
Purchase Details
Closed on
Oct 12, 2012
Sold by
Pepper Edna M
Bought by
Pepper Paul
Purchase Details
Closed on
Apr 1, 2002
Bought by
Pepper Paul E and Pepper Edna M
Purchase Details
Closed on
Aug 1, 2001
Bought by
Cooke Lonnie P
Purchase Details
Closed on
Mar 1, 2000
Bought by
Jquad Development Lp
Create a Home Valuation Report for This Property
The Home Valuation Report is an in-depth analysis detailing your home's value as well as a comparison with similar homes in the area
Home Values in the Area
Average Home Value in this Area
Purchase History
| Date | Buyer | Sale Price | Title Company |
|---|---|---|---|
| Guadagno Vincent S | $159,900 | -- | |
| Pepper Paul | -- | -- | |
| Pepper Paul | -- | -- | |
| Pepper Paul E | -- | -- | |
| Cooke Lonnie P | -- | -- | |
| Jquad Development Lp | -- | -- |
Source: Public Records
Mortgage History
| Date | Status | Borrower | Loan Amount |
|---|---|---|---|
| Open | Guadagno Vincent S | $17,000 |
Source: Public Records
Tax History Compared to Growth
Tax History
| Year | Tax Paid | Tax Assessment Tax Assessment Total Assessment is a certain percentage of the fair market value that is determined by local assessors to be the total taxable value of land and additions on the property. | Land | Improvement |
|---|---|---|---|---|
| 2024 | $2,725 | $122,276 | $18,000 | $104,276 |
| 2023 | $2,381 | $99,884 | $14,000 | $85,884 |
| 2022 | $1,682 | $79,923 | $10,160 | $69,763 |
| 2021 | $1,610 | $74,736 | $10,160 | $64,576 |
| 2020 | $1,582 | $71,607 | $10,160 | $61,447 |
| 2019 | $1,366 | $61,822 | $10,000 | $51,822 |
| 2018 | $1,281 | $58,434 | $10,000 | $48,434 |
| 2017 | $1,266 | $57,083 | $10,000 | $47,083 |
| 2016 | $1,277 | $56,131 | $10,000 | $46,131 |
| 2015 | $1,281 | $56,100 | $10,000 | $46,100 |
| 2014 | $1,181 | $56,100 | $10,000 | $46,100 |
Source: Public Records
Map
Nearby Homes
- 1238 Brooklet South Dr
- 0 Mincey Rd Unit 10654361
- 131 Landmark Cir Unit LOT 16
- 131 Landmark Cir
- 138 Landmark Cir
- 138 Landmark Cir Unit LOT 76
- 167 Landmark Cir
- 167 Landmark Cir Unit LOT 31
- 9990 Georgia 67
- 925 Cleary Rd
- 3276 Mud Rd
- 4031 Mud Rd
- 208 Hopecrest Rd Unit 63
- 209 Hopecrest Rd
- 210 Hopecrest Rd Unit 62
- 208 Hopecrest Rd
- 210 Hopecrest Rd
- 0 Clifton Rd Unit 10585882
- 0 Clifton Rd Unit SA339976
- 310 Parkersburg Ln Unit 50
- 1210 Brooklet South Dr
- 1210 Brooklet Dr S Unit L0T 6
- 1210 Brooklet Dr S
- 1212 Brooklet South Dr
- 1208 Brooklet Dr S Unit 5
- 1207 Brooklet South Dr
- 1214 Brooklet Dr S
- 1214 Brooklet South Dr
- 1206 Brooklet South Dr
- 1245 Brooklet Dr S Unit 48
- 1245 Brooklet South Dr Unit 48
- 1245 Brooklet South Dr
- 1205 Brooklet South Dr
- 1205 Brooklet Dr S
- 1211 Brooklet South Dr
- 1266 Brooklet South Dr
- 1216 Brooklet South Dr
- 0 Brooklet Dr S Unit 3188858
- 0 Brooklet Dr S Unit 3188855
- 0 Brooklet Dr S Unit 8824683