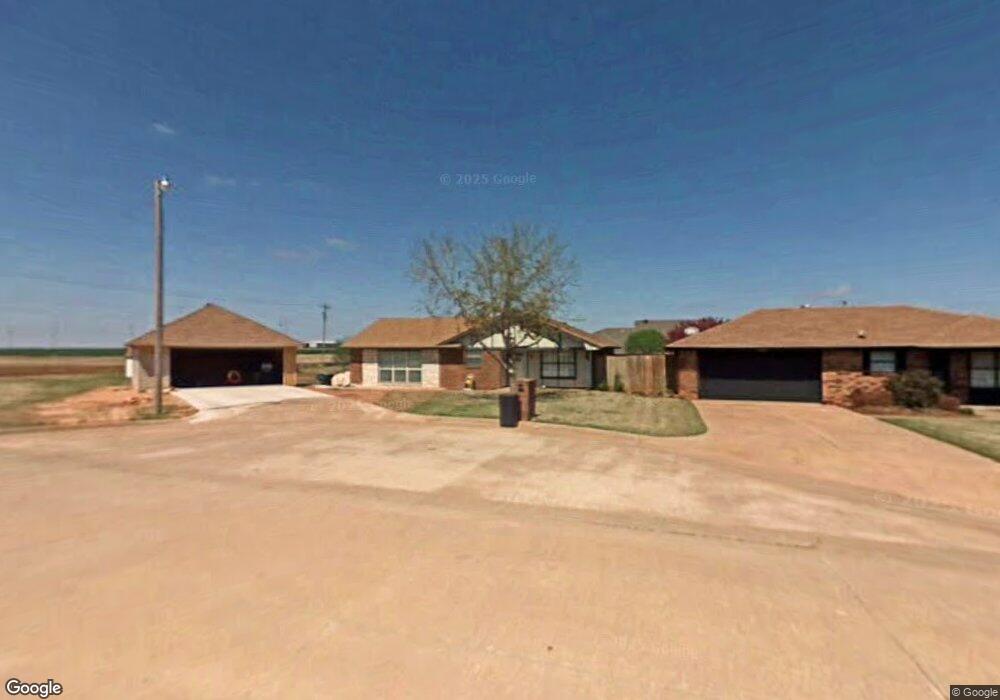
1210 Carl Ave Kingfisher, OK 73750
Estimated Value: $206,000 - $265,000
3
Beds
2
Baths
1,652
Sq Ft
$144/Sq Ft
Est. Value
About This Home
This home is located at 1210 Carl Ave, Kingfisher, OK 73750 and is currently estimated at $237,062, approximately $143 per square foot. 1210 Carl Ave is a home located in Kingfisher County with nearby schools including Gilmour Elementary School, Kingfisher Middle School, and Kingfisher High School.
Ownership History
Date
Name
Owned For
Owner Type
Purchase Details
Closed on
Mar 29, 2021
Sold by
Lippoldt Joshua and Lippoldt Jacy
Bought by
Fischer Bryce
Current Estimated Value
Home Financials for this Owner
Home Financials are based on the most recent Mortgage that was taken out on this home.
Original Mortgage
$186,868
Outstanding Balance
$167,599
Interest Rate
2.73%
Mortgage Type
New Conventional
Estimated Equity
$69,463
Purchase Details
Closed on
Mar 6, 2020
Sold by
Lippoldt Thomas J and Lippoldt Beverly G
Bought by
Lippoldt Joshua and Lippoldt Jacy
Purchase Details
Closed on
Jun 4, 2015
Sold by
Boeckman Dagan
Bought by
Lippoldt Joshua
Purchase Details
Closed on
Jul 14, 2011
Sold by
Boeckman Lyndsi
Bought by
Boeckman Dagan
Purchase Details
Closed on
May 16, 2006
Sold by
Johnson Larry D and Johnson Sheryl K
Bought by
Boeckman Dagan
Create a Home Valuation Report for This Property
The Home Valuation Report is an in-depth analysis detailing your home's value as well as a comparison with similar homes in the area
Home Values in the Area
Average Home Value in this Area
Purchase History
| Date | Buyer | Sale Price | Title Company |
|---|---|---|---|
| Fischer Bryce | $178,000 | Solomon Abstract Company | |
| Lippoldt Joshua | -- | None Available | |
| Lippoldt Joshua | $144,000 | -- | |
| Boeckman Dagan | -- | Solomon Abstract Company | |
| Boeckman Dagan | $81,500 | None Available |
Source: Public Records
Mortgage History
| Date | Status | Borrower | Loan Amount |
|---|---|---|---|
| Open | Fischer Bryce | $186,868 |
Source: Public Records
Tax History Compared to Growth
Tax History
| Year | Tax Paid | Tax Assessment Tax Assessment Total Assessment is a certain percentage of the fair market value that is determined by local assessors to be the total taxable value of land and additions on the property. | Land | Improvement |
|---|---|---|---|---|
| 2025 | $1,751 | $20,679 | $4,802 | $15,877 |
| 2024 | $1,751 | $20,559 | $4,384 | $16,175 |
| 2023 | $1,667 | $19,580 | $4,125 | $15,455 |
| 2022 | $1,699 | $19,580 | $4,125 | $15,455 |
| 2021 | $1,328 | $15,186 | $4,125 | $11,061 |
| 2020 | $1,323 | $15,186 | $4,125 | $11,061 |
| 2019 | $1,285 | $15,320 | $4,125 | $11,195 |
| 2018 | $1,299 | $15,507 | $4,125 | $11,382 |
| 2017 | $1,375 | $15,603 | $4,125 | $11,478 |
| 2016 | $1,390 | $15,840 | $4,125 | $11,715 |
| 2015 | $1,239 | $14,069 | $1,983 | $12,086 |
| 2014 | $1,145 | $13,659 | $990 | $12,669 |
Source: Public Records
Map
Nearby Homes
- 1907 Five Springs Ct
- 1905 Five Springs Ct
- 1901 Five Springs Ct
- 912 W Overstreet Ave
- 1202 S 13th St
- 1809 Clearwater Ct
- 1801 Clearwater Ct
- 1803 Clearwater Ct
- 806 Chateau Ct
- 904 N Park Place
- 1303 S 10th St
- 418 Mitchell Dr
- 310 Mitchell Dr
- 378 Mitchell Dr
- 344 Mitchell Dr
- 1302 S 8th St
- 1102 S 9th St
- 602 W Oklahoma Ave
- 1012 S 8th St
- 1212 S Main St
- 1208 Carl Ave
- 1209 Curran Ave
- 1210 Curran Ave
- 1215 Carl Ave
- 1206 Carl Ave
- 1211 Carl Ave
- 1207 Curran Ave
- 1209 Carl Ave
- 1204 Carl Ave
- 1205 Curran Ave
- 1208 Curran Ave
- 1202 Carl Ave
- 1205 Carl Ave
- 1208 Coleman Trail
- 1206 Curran Ave
- 1210 Coleman Trail
- 1203 Curran Ave
- 1206 Coleman Trail
- 1204 Curran Ave
- 1200 Carl Ave