S
Landlord's Agent in 2020
STEVE SUI
Georgia Realty Brokers International Corporation
(404) 839-7582
6 Total Sales
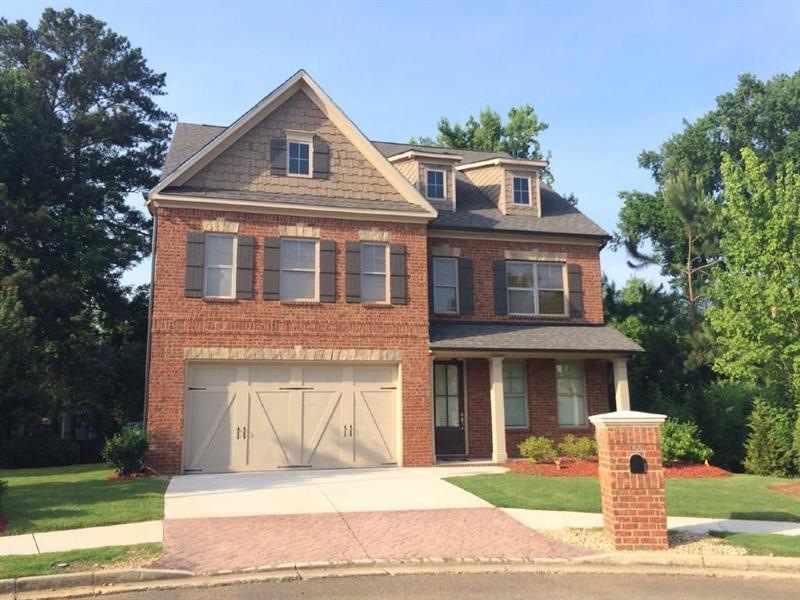
Estimated Value: $759,000 - $896,000
Location! Location! Location! In gated community. 3-story beautiful home with 4 bedrooms 3.5 bath in lovely Jones Bridge Estates Subdivision. Oversized great room with fireplace and lots of windows. large and spacious kitchen wih granite tops, stainless steel appliances, and overlooks great room. Upstairs features all bedrooms and laundry room. Third level has one spacious bedroom and a full bath. Hardwood floor all over the main level . Eye catching deck with view of wooded backyard. Super convenient location with all shops and restaurants. Great N Fulton schools.
| Date | Buyer | Sale Price | Title Company |
|---|---|---|---|
| Qingju Yan | -- | -- | |
| Zhu Ying Dong | $398,700 | -- | |
| Sr Homes Llc | -- | -- | |
| Trey Investment Properties Llc | $113,000 | -- |
| Date | Event | Price | List to Sale | Price per Sq Ft | Prior Sale |
|---|---|---|---|---|---|
| 03/01/2020 03/01/20 | Rented | $2,700 | -1.8% | -- | |
| 02/24/2020 02/24/20 | Under Contract | -- | -- | -- | |
| 01/27/2020 01/27/20 | Price Changed | $2,750 | -3.5% | $1 / Sq Ft | |
| 12/18/2019 12/18/19 | For Rent | $2,850 | 0.0% | -- | |
| 03/12/2014 03/12/14 | Sold | $398,700 | +2.3% | $131 / Sq Ft | View Prior Sale |
| 01/15/2014 01/15/14 | Pending | -- | -- | -- | |
| 07/25/2013 07/25/13 | For Sale | $389,900 | -- | $128 / Sq Ft |
| Year | Tax Paid | Tax Assessment Tax Assessment Total Assessment is a certain percentage of the fair market value that is determined by local assessors to be the total taxable value of land and additions on the property. | Land | Improvement |
|---|---|---|---|---|
| 2025 | $8,437 | $281,080 | $90,160 | $190,920 |
| 2023 | $5,162 | $182,880 | $42,040 | $140,840 |
| 2022 | $5,612 | $182,880 | $42,040 | $140,840 |
| 2021 | $5,594 | $177,560 | $40,800 | $136,760 |
| 2020 | $5,784 | $179,680 | $58,720 | $120,960 |
| 2019 | $696 | $176,520 | $57,680 | $118,840 |
| 2018 | $5,615 | $172,400 | $56,360 | $116,040 |
| 2017 | $5,075 | $149,120 | $42,680 | $106,440 |
| 2016 | $5,002 | $149,120 | $42,680 | $106,440 |
| 2015 | $5,058 | $149,120 | $42,680 | $106,440 |
| 2014 | $5,259 | $149,120 | $42,680 | $106,440 |
S
Landlord's Agent in 2020
STEVE SUI
Georgia Realty Brokers International Corporation
(404) 839-7582
6 Total Sales

Tenant's Agent in 2020
Grace Min
GreenPoint Realty, LLC
(404) 838-7564
20 Total Sales
J
Seller's Agent in 2014
Janet Nicholson
NOT A VALID MEMBER
Source: First Multiple Listing Service (FMLS)
MLS Number: 6656887
APN: 11-0450-0193-118-9
Disclaimer: Certain information contained herein is derived from information provided by parties other than Homes.com. All information provided is deemed reliable, but is not guaranteed to be accurate and should be independently verified.
![]() Listings identified with the FMLS IDX logo come from FMLS and are held by brokerage firms other than the owner of this website. The listing brokerage is identified in any listing details. Information is deemed reliable but is not guaranteed. If you believe any FMLS listing contains material that infringes your copyrighted work please visit www.fmls.com/dmca to review our DMCA policy and learn how to submit a takedown request. © 2025 First Multiple Listing Service, Inc.
Listings identified with the FMLS IDX logo come from FMLS and are held by brokerage firms other than the owner of this website. The listing brokerage is identified in any listing details. Information is deemed reliable but is not guaranteed. If you believe any FMLS listing contains material that infringes your copyrighted work please visit www.fmls.com/dmca to review our DMCA policy and learn how to submit a takedown request. © 2025 First Multiple Listing Service, Inc.